
Fig. 2
- ID
- ZDB-IMAGE-240906-31
- Genes
- Publication
- Deng et al., 2024 - Cdon is essential for organ left-right patterning by regulating dorsal forerunner cells clustering and Kupffer's vesicle morphogenesis
- All Figures
- Figures for Deng et al., 2024
|
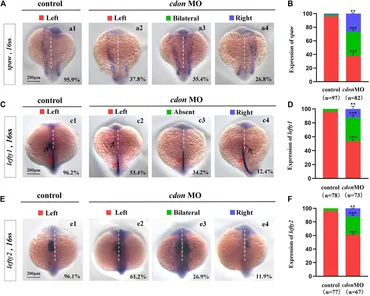
Fig. 2 Expression of left-sided Nodal signaling in controls and embryos injected with cdon MO (A,B) Expression of spaw was evaluated in different groups of embryos. a1, left-sided spaw in controls (95.9%, n = 97); a2, left-sided spaw in embryos injected with cdon MO (37.8%, n = 82, p < 0.001); a3, bilateral spaw in embryos injected with cdon MO (35.4%, n = 82, p < 0.001); a4, right-sided spaw in embryos injected with cdon MO (26.8%, n = 82, p < 0.01). (C,D) Lefty1 is expressed in the heart field (black arrow) and trunk midline (red arrow) in controls and embryos injected with cdon MO. c1, left-sided lefty1 in embryos being as controls (96.2%, n = 78, black arrow showed); c2, left-sided lefty1 in embryos injected with cdon MO (53.4%, n = 73, p < 0.001, black arrow showed); c3, absent lefty1 in embryos injected with cdon MO (34.2%, n = 73, p < 0.001); c4, right-sided lefty1 in embryos injected with cdon MO (12.4%, n = 73, p < 0.01, black arrow showed) (E,F) Lefty2 is examined in control embryos and embryos injected with cdon MO. e1, left-sided lefty2 in controls (96.1%, n = 77); e2, left-sided lefty2 in embryos injected with cdon MO (61.2%, n = 67, p < 0.001); e3, bilateral expression of lefty2 in embryos injected with cdon MO (26.9%, n = 67, p < 0.001); e4, right-sided lefty2 in embryos injected with cdon MO (11.9%, n = 67, p < 0.01). Statistical analysis was performed using Student’s t-test. “**” p < 0.01, “***” p < 0.001. Notice: “control” refers to wild-type embryos that were not injected with cdon MO.