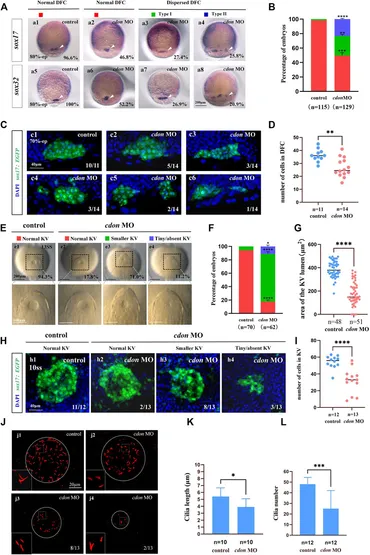
Fig. 3 Cdon loss of function disturbs clustering DFCs, KV morphogenesis and cilia (A) Expression of sox17 and sox32 was examined using WISH at 80% epiboly (white arrow). a1, normal expression of sox17 in controls (96.6%, n = 58); a2, normal expression of sox17 in embryos injected with cdon MO at the 4-cell stage (46.8%, n = 62); a3, dispersed expression of sox17 (type I) in embryos injected with cdon MO at the 4-cell stage (27.4%, n = 62); a4, dispersed expression of sox17 (type II) in embryos injected with cdon MO at the 4-cell stage (25.8%, n = 62). a5, normal expression of sox32 in controls (100%, n = 57); a6, normal expression of sox32 in embryos injected with cdon MO at the 4-cell stage (52.2%, n = 67); a7, dispersed expression of sox32 (type I) in embryos injected with cdon MO at the 4-cell stage (26.9%, n = 67); a8, dispersed expression of sox32 (type II) in embryos injected with cdon MO at the 4-cell stage (20.9%, n = 67). (B) Statistical analysis was performed for the expression of sox17 and sox32 in controls and embryos injected with cdon MO. Here all the embryos staining with sox17 or sox32 were used together to calculate the percentage. Normal DFC and dispersed DFC show significant differences between control embryos and embryos injected with cdon MO at the 4-cell stage. (C) Using Tg (sox17:EGFP) transgenic zebrafish to detect DFC cell migration at the 70% epiboly stage in both control embryos and embryos injected with cdon MO at the 4-cell stage. c1, the DFCs in control embryos are tightly clustered (10/11, n = 11); c2, tightly clustered DFCs in embryos injected with cdon MO at the 4-cell stage (5/14, n = 14). c3, in embryos injected with cdon MO at the 4-cell stage, the DFCs are arranged in an elongated pattern with a reduced number of cells (3/14, n = 14). c4, mildly dispersed DFCs in embryos injected with cdon MO at the 4-cell stage (3/14, n = 14). c5, moderately dispersed DFCs in embryos injected with cdon MO at the 4-cell stage (2/14, n = 14). c6, in embryos injected with cdon MO at the 4-cell stage, the DFCs are dispersed, and the number of cells is significantly reduced (1/14, n = 14). (D) Number of cells in DFC in control and cdon MO-injected embryos. “n” represents the sample size. (E,F) KV morphology was evaluated. e1, normal KV in embryos in controls (94.3%, n = 70); e2, normal KV in embryos injected with cdon MO at the 4-cell stage (17.8%, n = 62, p < 0.001); e3, smaller KV in embryos injected with cdon MO at the 4-cell stage (71.0%, n = 62, p < 0.0001); e4, tiny/absent KV in embryos injected with cdon MO at the 4-cell stage (11.2%, n = 62, p < 0.05). “Normal KV” represents a KV lumen area greater than 300 μm2, “smaller KV” represents a KV lumen area between 100 and 300 μm2, and “tiny/absent KV” represents a KV lumen area less than 100 μm2. (G) Area of the KV lumen (µm2) in control and cdon MO-injected embryos. “n” represents the sample size. (H) The number of epithenium cells in KV were measured on confocal images. (I) Number of epithenium cells in KV in control and cdon MO-injected embryos. “n” represents the sample size. (J) Number and length of cilia were evaluated in controls and embryos injected with cdon MO. j1, cilia in embryos being as controls; j2-j4, cilia in embryos injected with cdon MO at the 4-cell stage. (K) Statistical chart for cilia length in KV. “n”represents the sample size. (L) Statistical chart for cilia number in KV. “n”represents the sample size. Statistical analysis was performed using Student’s t-test. “*” p < 0.05, “**” p < 0.01, “***” p < 0.001, “****” p < 0.0001. Notice: “control” refers to wild-type embryos that were not injected with cdon MO.
Image
Figure Caption
Figure Data
Acknowledgments
This image is the copyrighted work of the attributed author or publisher, and
ZFIN has permission only to display this image to its users.
Additional permissions should be obtained from the applicable author or publisher of the image.
Full text @ Front Cell Dev Biol

