
- Title
-
CPT2 Deficiency Modeled in Zebrafish: Abnormal Neural Development, Electrical Activity, Behavior, and Schizophrenia-Related Gene Expression
- Authors
- Baker, C.E., Marta, A.G., Zimmerman, N.D., Korade, Z., Mathy, N.W., Wilton, D., Simeone, T., Kochvar, A., Kramer, K.L., Stessman, H.A.F., Shibata, A.
- Source
- Full text @ Biomolecules
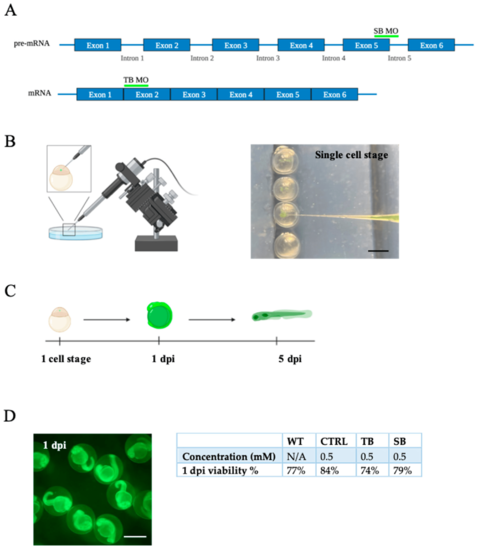
Generation of vertebrate CPT2 knockdown model system in zebrafish. (A). Morpholino binding site for splice blocking (SB) and translation blocking (TB) MOs on pre-mRNA and mature mRNA, respectively. (B). Graphic of embryos microinjected with fluorescein-labeled morpholino oligonucleotide (MO) at single-cell stage using Narishige injector. Phase bright image of embryos being microinjected at the single-cell stage. (C). Timeline CPT2 knockdown model system following MO injection. At 1 dpi, embryos were screened for fluorescein. Viable embryos that were positive for fluorescein (fluorescein+) were raised to 5 dpi for all experiments to evaluate larval development. (D). Image of fluorescein+ embryos at 1 dpi. Percent viability of fluorescein+ embryos at 1 dpi compared to uninjected WT zebrafish. N = 15–48 fish per condition for each of three trials. WT = wildtype zebrafish; CTRL = control, scrambled MO-injected zebrafish; TB = translation blocking MO-injected zebrafish; and SB = splice blocking MO-injected zebrafish. (A–C). Images were designed using BioRender.com (Toronto, ON, Canada). Scale bar = 0.5 mm. |
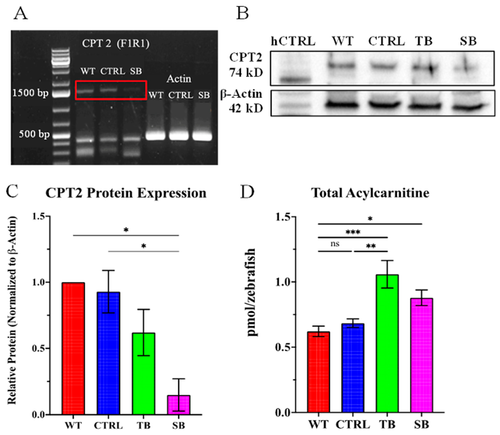
Evaluation of morpholino CPT2 knockdown. (A). PCR amplification of full-length cpt2 run on 1% agarose gel. Actin was used as reference and control. N = 30 fish per condition. Red box indicates the expected cpt2 PCR product. (B). Representative Western blot for CPT2 expression in control and MO knockdown zebrafish. Human CPT2 lysate (hCPT2) was used as positive control. Actin was used as protein loading control. (C). CPT2 protein expression in MO knockdown zebrafish relative to WT. Protein levels were normalized to loading control β-actin. N = 200 fish per condition for each trial. Error bars = standard error of difference of 0.19 as determined by ordinary one-way ANOVA. (D). Total fatty-acylcarnitine expression evaluated using LC-MS/MS. N = 30 fish per condition for each of five trials. Error bars = SEM. (A–D). WT = wildtype zebrafish; CTRL = control, scrambled MO-injected zebrafish; TB = translation blocking MO-injected zebrafish; SB = splice blocking MO-injected zebrafish. * p ≤ 0.05, ** p ≤ 0.01, *** p ≤ 0.001, ns = not significant. |
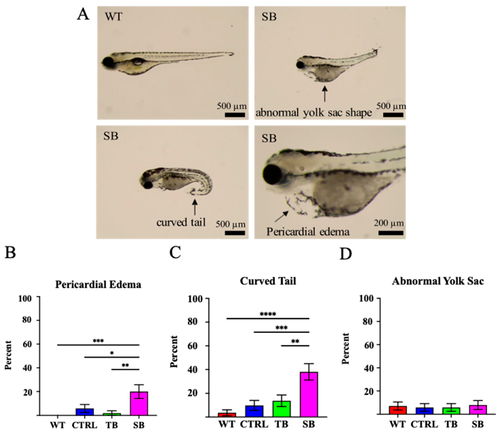
Phenotypic assessment of CPT2 knockdown larvae. (A). CPT2 knockdown larvae at 5 dpi presented with several predominant phenotypic differences such as pericardial edema, curved tail, and abnormal yolk sac shape. Representative images of SB-injected phenotypes (SB) and wildtype (WT) comparison are shown. Scale bar = 500 µm and 200 µm, respectively. (B–D). Percent of qualitative phenotypic differences was compared between conditions. (A–D). WT = wildtype zebrafish; CTRL = control, scrambled MO-injected zebrafish; TB = translation blocking MO-injected zebrafish; SB = splice blocking MO-injected zebrafish. N = 50 fish per condition. * p ≤ 0.05, ** p ≤ 0.01, *** p ≤ 0.001, **** p ≤ 0.0001. Error bars = SEM. |
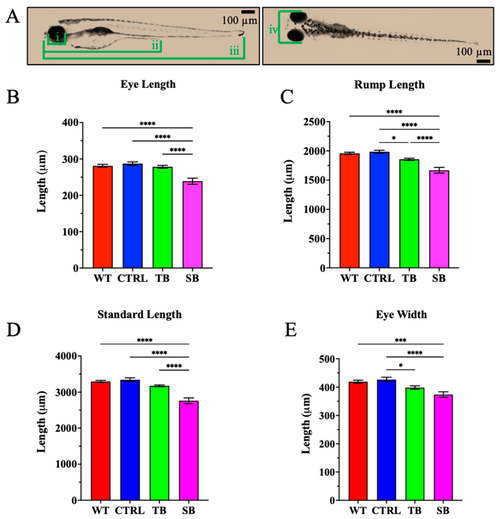
Body development in CPT2 knockdown larvae. (A). Measurements of head and body development were obtained using four consistent measurements. (i) Eye length, (ii) rump length, (iii) standard length, (iv) eye width. Scale bar = 100 µm. (B–E). Measurements for eye length, rump length, standard length, and eye width. (B–E). WT = wildtype; CTRL = control, scrambled MO-injected zebrafish; TB = translation blocking MO-injected zebrafish; SB = splice blocking MO-injected zebrafish. N = 50 fish per condition. * p ≤ 0.05, *** p ≤ 0.001, **** p ≤ 0.0001. Error bars = SEM. |
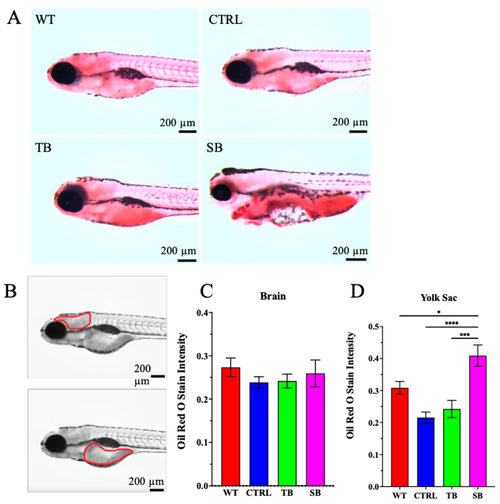
Lipid deposition in CPT2 knockdown larvae. (A). Oil Red O whole-mount staining was performed on 5 dpi larvae to evaluate lipid deposition. Scale bar = 200 µm. (B). Greyscale images were quantified for pixel intensity in brain and yolk sac to determine intensity of Oil Red O stain. Scale bar = 200 µm. (C–D). Oil Red O stain intensity in brain and yolk sac. (A–D). WT = wildtype; CTRL = control, scrambled MO-injected zebrafish; TB = translation blocking MO-injected zebrafish; SB = splice blocking MO-injected zebrafish. N ≤ 10 zebrafish per condition. * p ≤ 0.05, *** p < 0.001, **** p < 0.0001. Error bars = SEM |
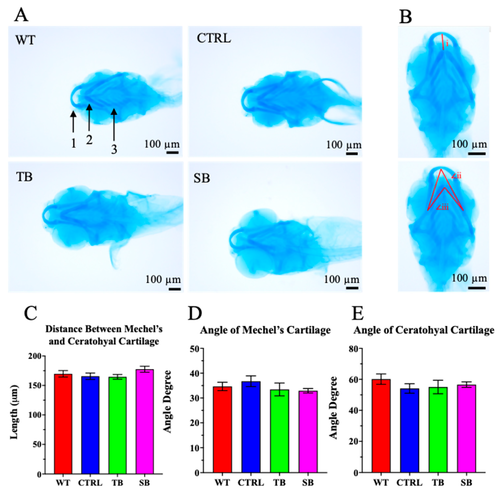
Cartilage development in CPT2 knockdown larvae. (A). Alcian blue stain was performed on 5 dpi larvae to evaluate cartilage development. Areas of focus were Mechel’s cartilage (1), ceratohyal cartilage (2), and ceratobranchial cartilage i–v (3). Scale bar = 100 µm. (B). Cartilage development was assessed on distance between Mechel’s and ceratohyal cartilage (i), angle of Mechel’s cartilage (∠ii), and angle of ceratohyal cartilage (∠iii). (C,D). Quantification of cartilage measurements. (A–E). WT = wildtype; CTRL = control, scrambled MO-injected fish; TB = translation blocking MO-injected zebrafish; SB = splice blocking MO. N ≤ 11 zebrafish per condition. Error bars = SEM. |
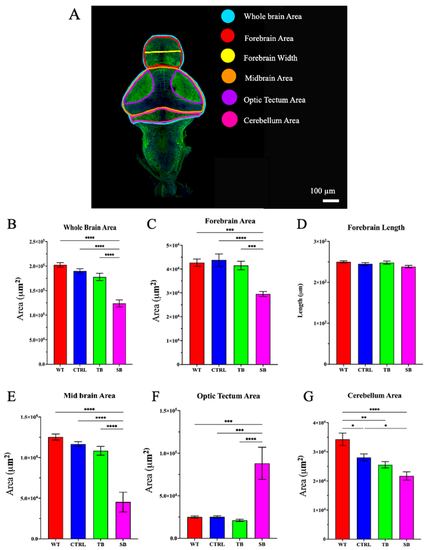
Brain development in CPT2 knockdown larvae. (A). Dissected zebrafish brain immunostained with acetylated tubulin. Schematic map of brain regions that were measured. Scale bar = 100 µm. (B–G). Quantification of area and length measurements from dissected and acetylated tubulin-stained brains. WT = wildtype zebrafish; CTRL = control, scrambled MO-injected zebrafish; TB = translation blocking MO-injected zebrafish; SB = splice blocking MO-injected zebrafish. N = 8–16 zebrafish brains per condition. * p ≤ 0.05, ** p < 0.01, *** p < 0.001, **** p < 0.0001. Error bars = SEM. |
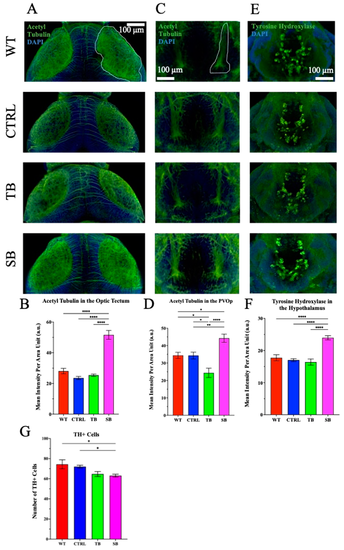
Immunofluorescence of neuronal network structure in CPT2 knockdown larvae brains. Brains were labeled with acetylated tubulin (green) and counterstained with DAPI. (A,B). The optic tectum is outlined in white and viewed on the dorsal side of the larvae. (C,D). The paraventricular organ posterior part (PVOp) region of the brain is outlined in white on the ventral side of the larvae. N = 8–16 per condition. (E,F). Brains were immunostained for tyrosine hydroxylase (green) and DAPI. The hypothalamus on the ventral side of the larva brain is shown. (G). Tyrosine hydroxylase-positive cells were counted from the hypothalamus. (A,C,E). Scale bar = 100 µm. (A–G). WT = wildtype, CTRL = control MO, TB = translation blocking MO, SB = splice blocking MO. N = 8–10 zebrafish brains per condition. * p ≤ 0.05, ** p < 0.01, **** p < 0.0001. Error bars = SEM |
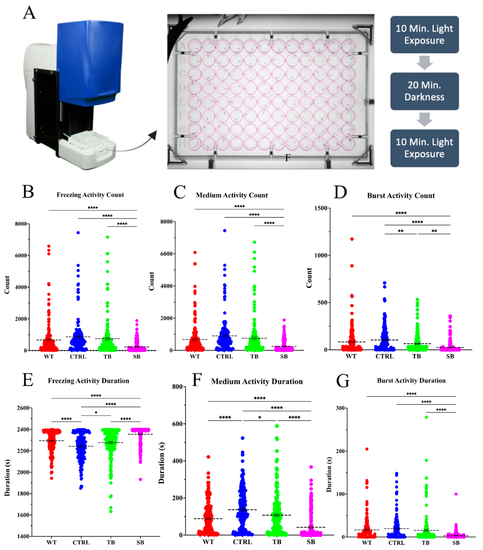
Swimming speeds in CPT2 knockdown larvae. (A). Behavior assays performed in ViewPoint Zebrabox with individual fish in 96-well plate for 40 min with light stimulation: 10 min light, 20 min dark, 10 min light. (B–G). Quantification of quantization assay measuring larvae freezing and swimming activity count and duration. WT = wildtype, CTRL = control MO, TB = translation blocking MO, SB = splice blocking MO. N = 96 fish used per condition for each of two trials. Dotted black lines = mean value. * p ≤ 0.05, ** p < 0.01, **** p < 0.0001. Error bars = SEM |
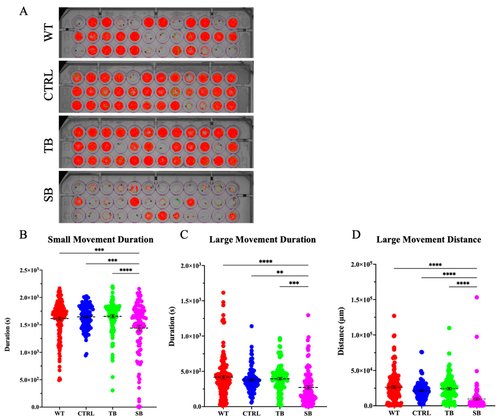
Swimming distance in CPT2 knockdown larvae. Tracking behavioral assay was performed using ViewPoint Zebrabox for 40 min with changing light stimulation; 10 min of light, 20 min of darkness, 10 min of light. (A). Tracked movement indicated by red (tracks small movement) and green (tracks large movement) lines for individual larvae during 40 min recording. (B–D). Quantification of tracking assay of larvae movement duration and distance. (A–D). WT = wildtype, CTRL = control MO, TB = translation blocking MO, SB = splice blocking MO. N = 60 fish used per condition for each of two trials. ** p < 0.01, *** p < 0.001, **** p < 0.0001. Dotted black lines = mean value. Error bars = SEM. |
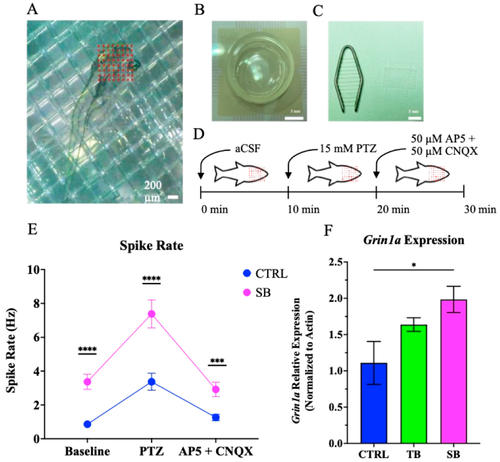
Seizure susceptibility and Grin1a expression. (A). Secured, living 5 dpi zebrafish on MED64 electrode. Scale bar = 200 µm. (B). MED64 electrode dish. Scale bar = 5 mm. (C). Tissue harp and mesh for securing larvae to electrode. Scale bar = 5 mm. (D). Schematic of 30 min electrophysiology recording, 10 min of artificial cerebrospinal fluid (aCSF) perfusion, 10 min of Pentylenetetrazol (PTZ) perfusion, and 10 min of 2(R)-amino-5-phosphonopentanoate and cyanquixaline (AP5 + CNQX) perfusion. (E). Spike rate (Hz) of CTRL and SB larvae. N = 3 zebrafish per condition. (F). Grin1a gene expression evaluated through RT-qPCR. N = 30 fish per condition for each of four trials. (E–F). CTRL = control MO, TB = translation blocking MO, SB = splice blocking MO. * p ≤ 0.05, *** p < 0.001, **** p < 0.0001. Error bars = SEM. |
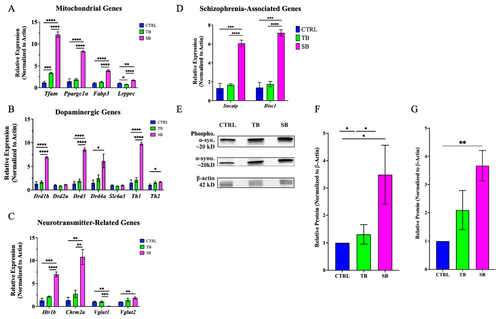
Gene expression in CPT2 knockdown larvae. (A). Mitochondrial gene expression. (B). Dopaminergic gene expression. (C). Neurotransmitter-related gene expression. (D). Schizophrenia-linked gene expression. (E). Western blot of phosphorylated and unphosphorylated α-synuclein compared to actin. (F). Quantification of unphosphorylated α-synuclein protein expression. (G). Quantification of phosphorylated α-synuclein protein expression. (B–D). WT = wildtype zebrafish; CTRL = control, scrambled MO-injected zebrafish; TB = translation blocking MO-injected zebrafish; SB = splice blocking MO-injected zebrafish. N = 30 zebrafish per condition for each of four trials. * p ≤ 0.05, ** p < 0.01, *** p < 0.001, **** p < 0.0001. Error bars = SEM. |