
|
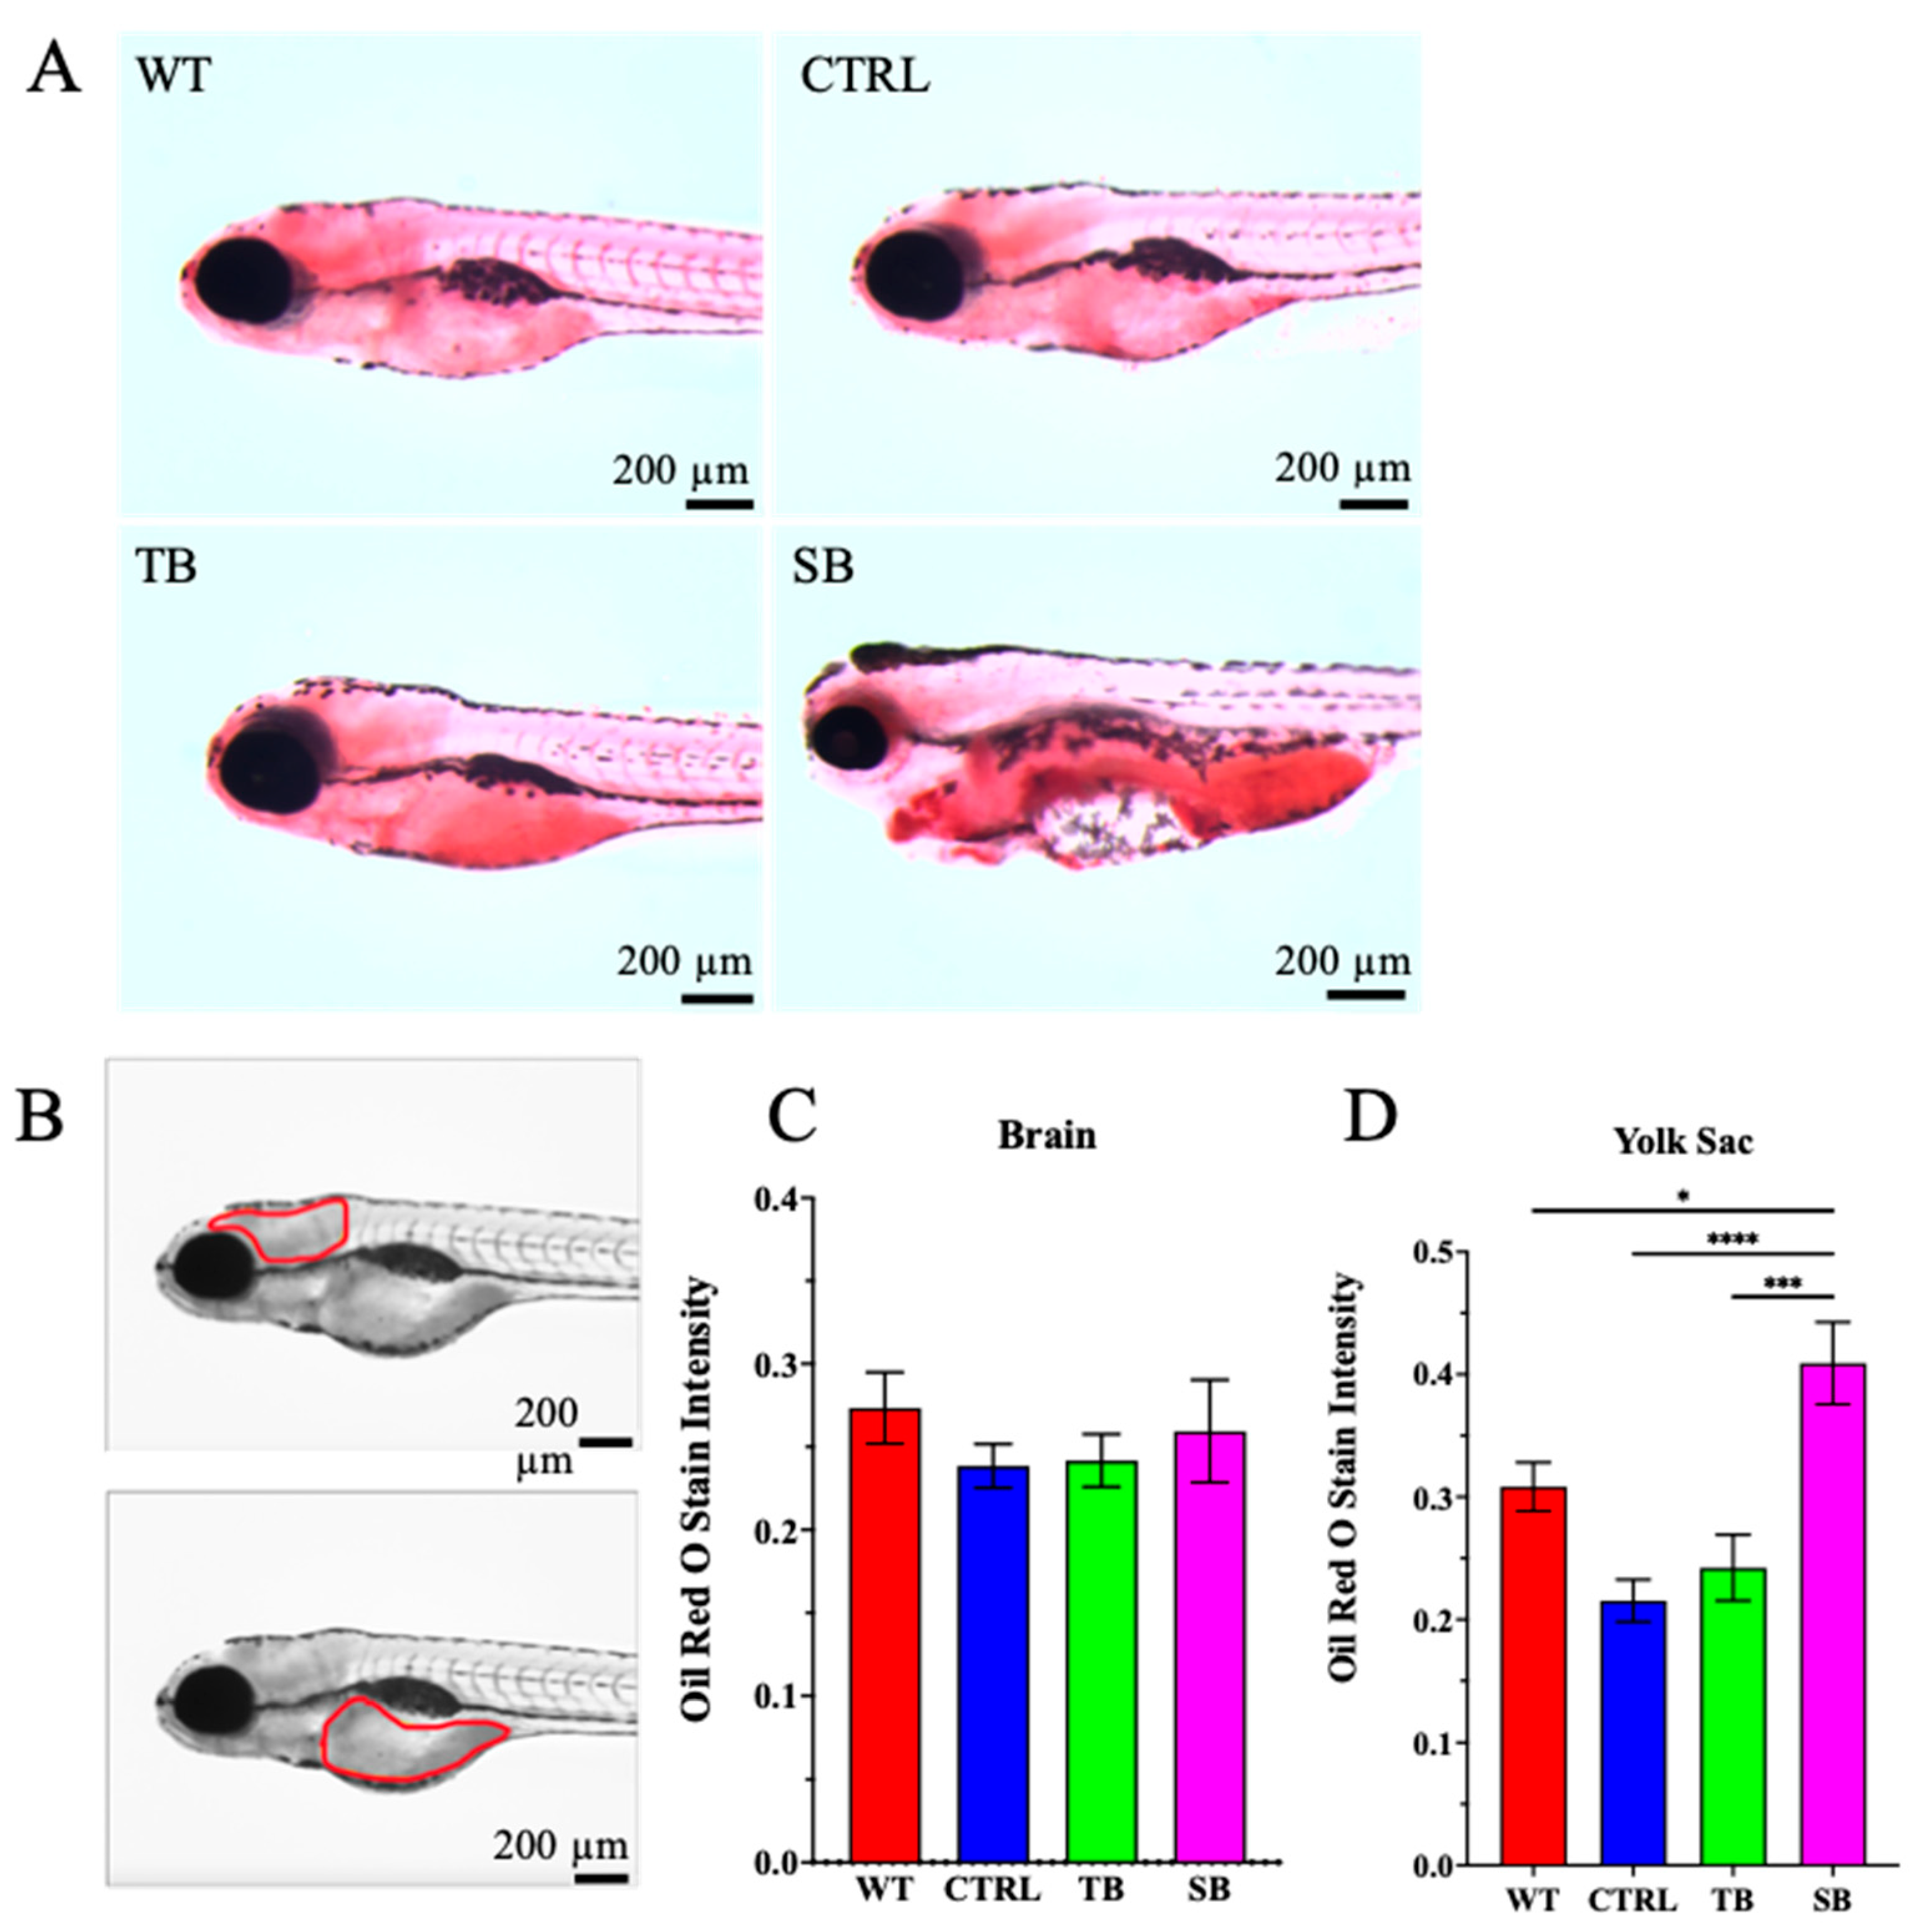
Fig. 5 Lipid deposition in CPT2 knockdown larvae. (A). Oil Red O whole-mount staining was performed on 5 dpi larvae to evaluate lipid deposition. Scale bar = 200 µm. (B). Greyscale images were quantified for pixel intensity in brain and yolk sac to determine intensity of Oil Red O stain. Scale bar = 200 µm. (C–D). Oil Red O stain intensity in brain and yolk sac. (A–D). WT = wildtype; CTRL = control, scrambled MO-injected zebrafish; TB = translation blocking MO-injected zebrafish; SB = splice blocking MO-injected zebrafish. N ≤ 10 zebrafish per condition. * p ≤ 0.05, *** p < 0.001, **** p < 0.0001. Error bars = SEM