
FIGURE
Fig. 9
- ID
- ZDB-FIG-240903-89
- Publication
- Baker et al., 2024 - CPT2 Deficiency Modeled in Zebrafish: Abnormal Neural Development, Electrical Activity, Behavior, and Schizophrenia-Related Gene Expression
- Other Figures
- All Figure Page
- Back to All Figure Page
Fig. 9
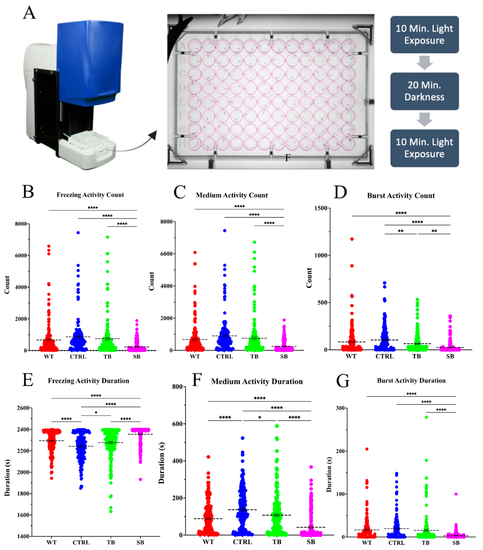
Swimming speeds in CPT2 knockdown larvae. (A). Behavior assays performed in ViewPoint Zebrabox with individual fish in 96-well plate for 40 min with light stimulation: 10 min light, 20 min dark, 10 min light. (B–G). Quantification of quantization assay measuring larvae freezing and swimming activity count and duration. WT = wildtype, CTRL = control MO, TB = translation blocking MO, SB = splice blocking MO. N = 96 fish used per condition for each of two trials. Dotted black lines = mean value. * p ≤ 0.05, ** p < 0.01, **** p < 0.0001. Error bars = SEM |
Expression Data
Expression Detail
Antibody Labeling
Phenotype Data
Phenotype Detail
Acknowledgments
This image is the copyrighted work of the attributed author or publisher, and
ZFIN has permission only to display this image to its users.
Additional permissions should be obtained from the applicable author or publisher of the image.
Full text @ Biomolecules