
Fig. 10
- ID
- ZDB-FIG-240903-90
- Publication
- Baker et al., 2024 - CPT2 Deficiency Modeled in Zebrafish: Abnormal Neural Development, Electrical Activity, Behavior, and Schizophrenia-Related Gene Expression
- Other Figures
- All Figure Page
- Back to All Figure Page
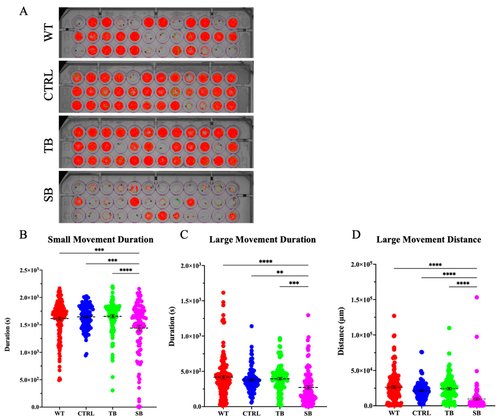
Swimming distance in CPT2 knockdown larvae. Tracking behavioral assay was performed using ViewPoint Zebrabox for 40 min with changing light stimulation; 10 min of light, 20 min of darkness, 10 min of light. (A). Tracked movement indicated by red (tracks small movement) and green (tracks large movement) lines for individual larvae during 40 min recording. (B–D). Quantification of tracking assay of larvae movement duration and distance. (A–D). WT = wildtype, CTRL = control MO, TB = translation blocking MO, SB = splice blocking MO. N = 60 fish used per condition for each of two trials. ** p < 0.01, *** p < 0.001, **** p < 0.0001. Dotted black lines = mean value. Error bars = SEM. |