
|
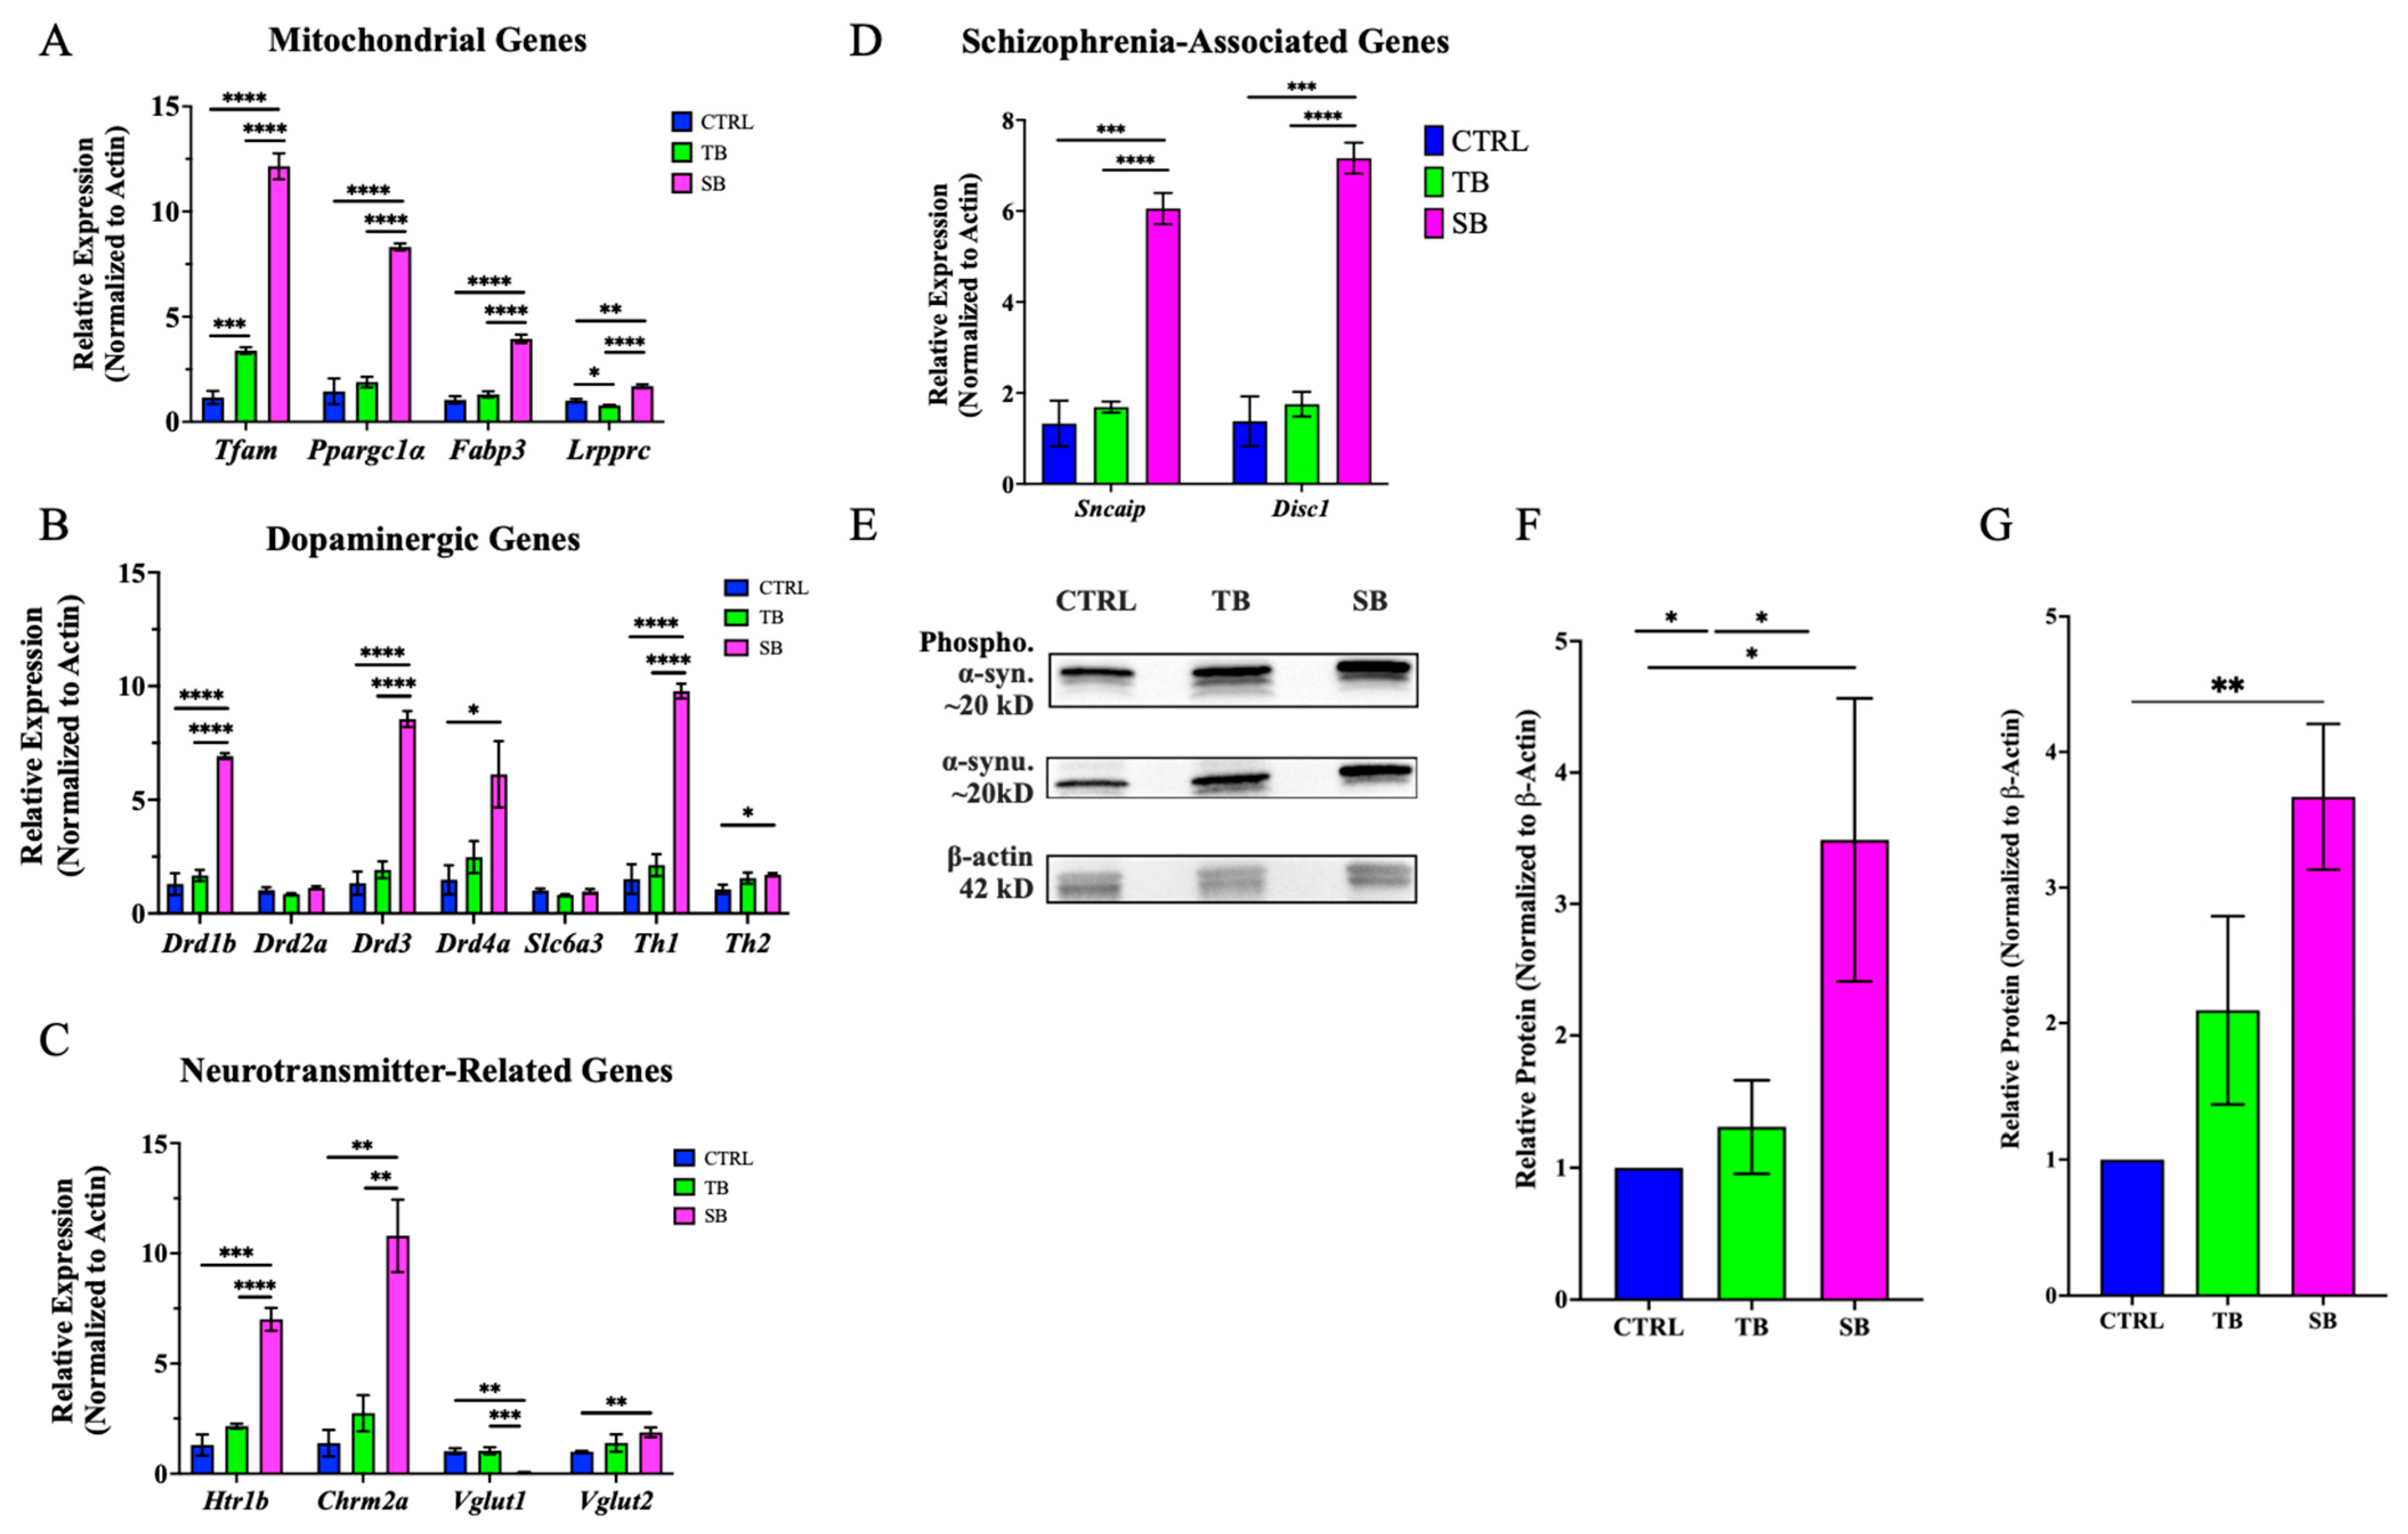
Fig. 12 Gene expression in CPT2 knockdown larvae. (A). Mitochondrial gene expression. (B). Dopaminergic gene expression. (C). Neurotransmitter-related gene expression. (D). Schizophrenia-linked gene expression. (E). Western blot of phosphorylated and unphosphorylated α-synuclein compared to actin. (F). Quantification of unphosphorylated α-synuclein protein expression. (G). Quantification of phosphorylated α-synuclein protein expression. (B–D). WT = wildtype zebrafish; CTRL = control, scrambled MO-injected zebrafish; TB = translation blocking MO-injected zebrafish; SB = splice blocking MO-injected zebrafish. N = 30 zebrafish per condition for each of four trials. * p ≤ 0.05, ** p < 0.01, *** p < 0.001, **** p < 0.0001. Error bars = SEM.