
|
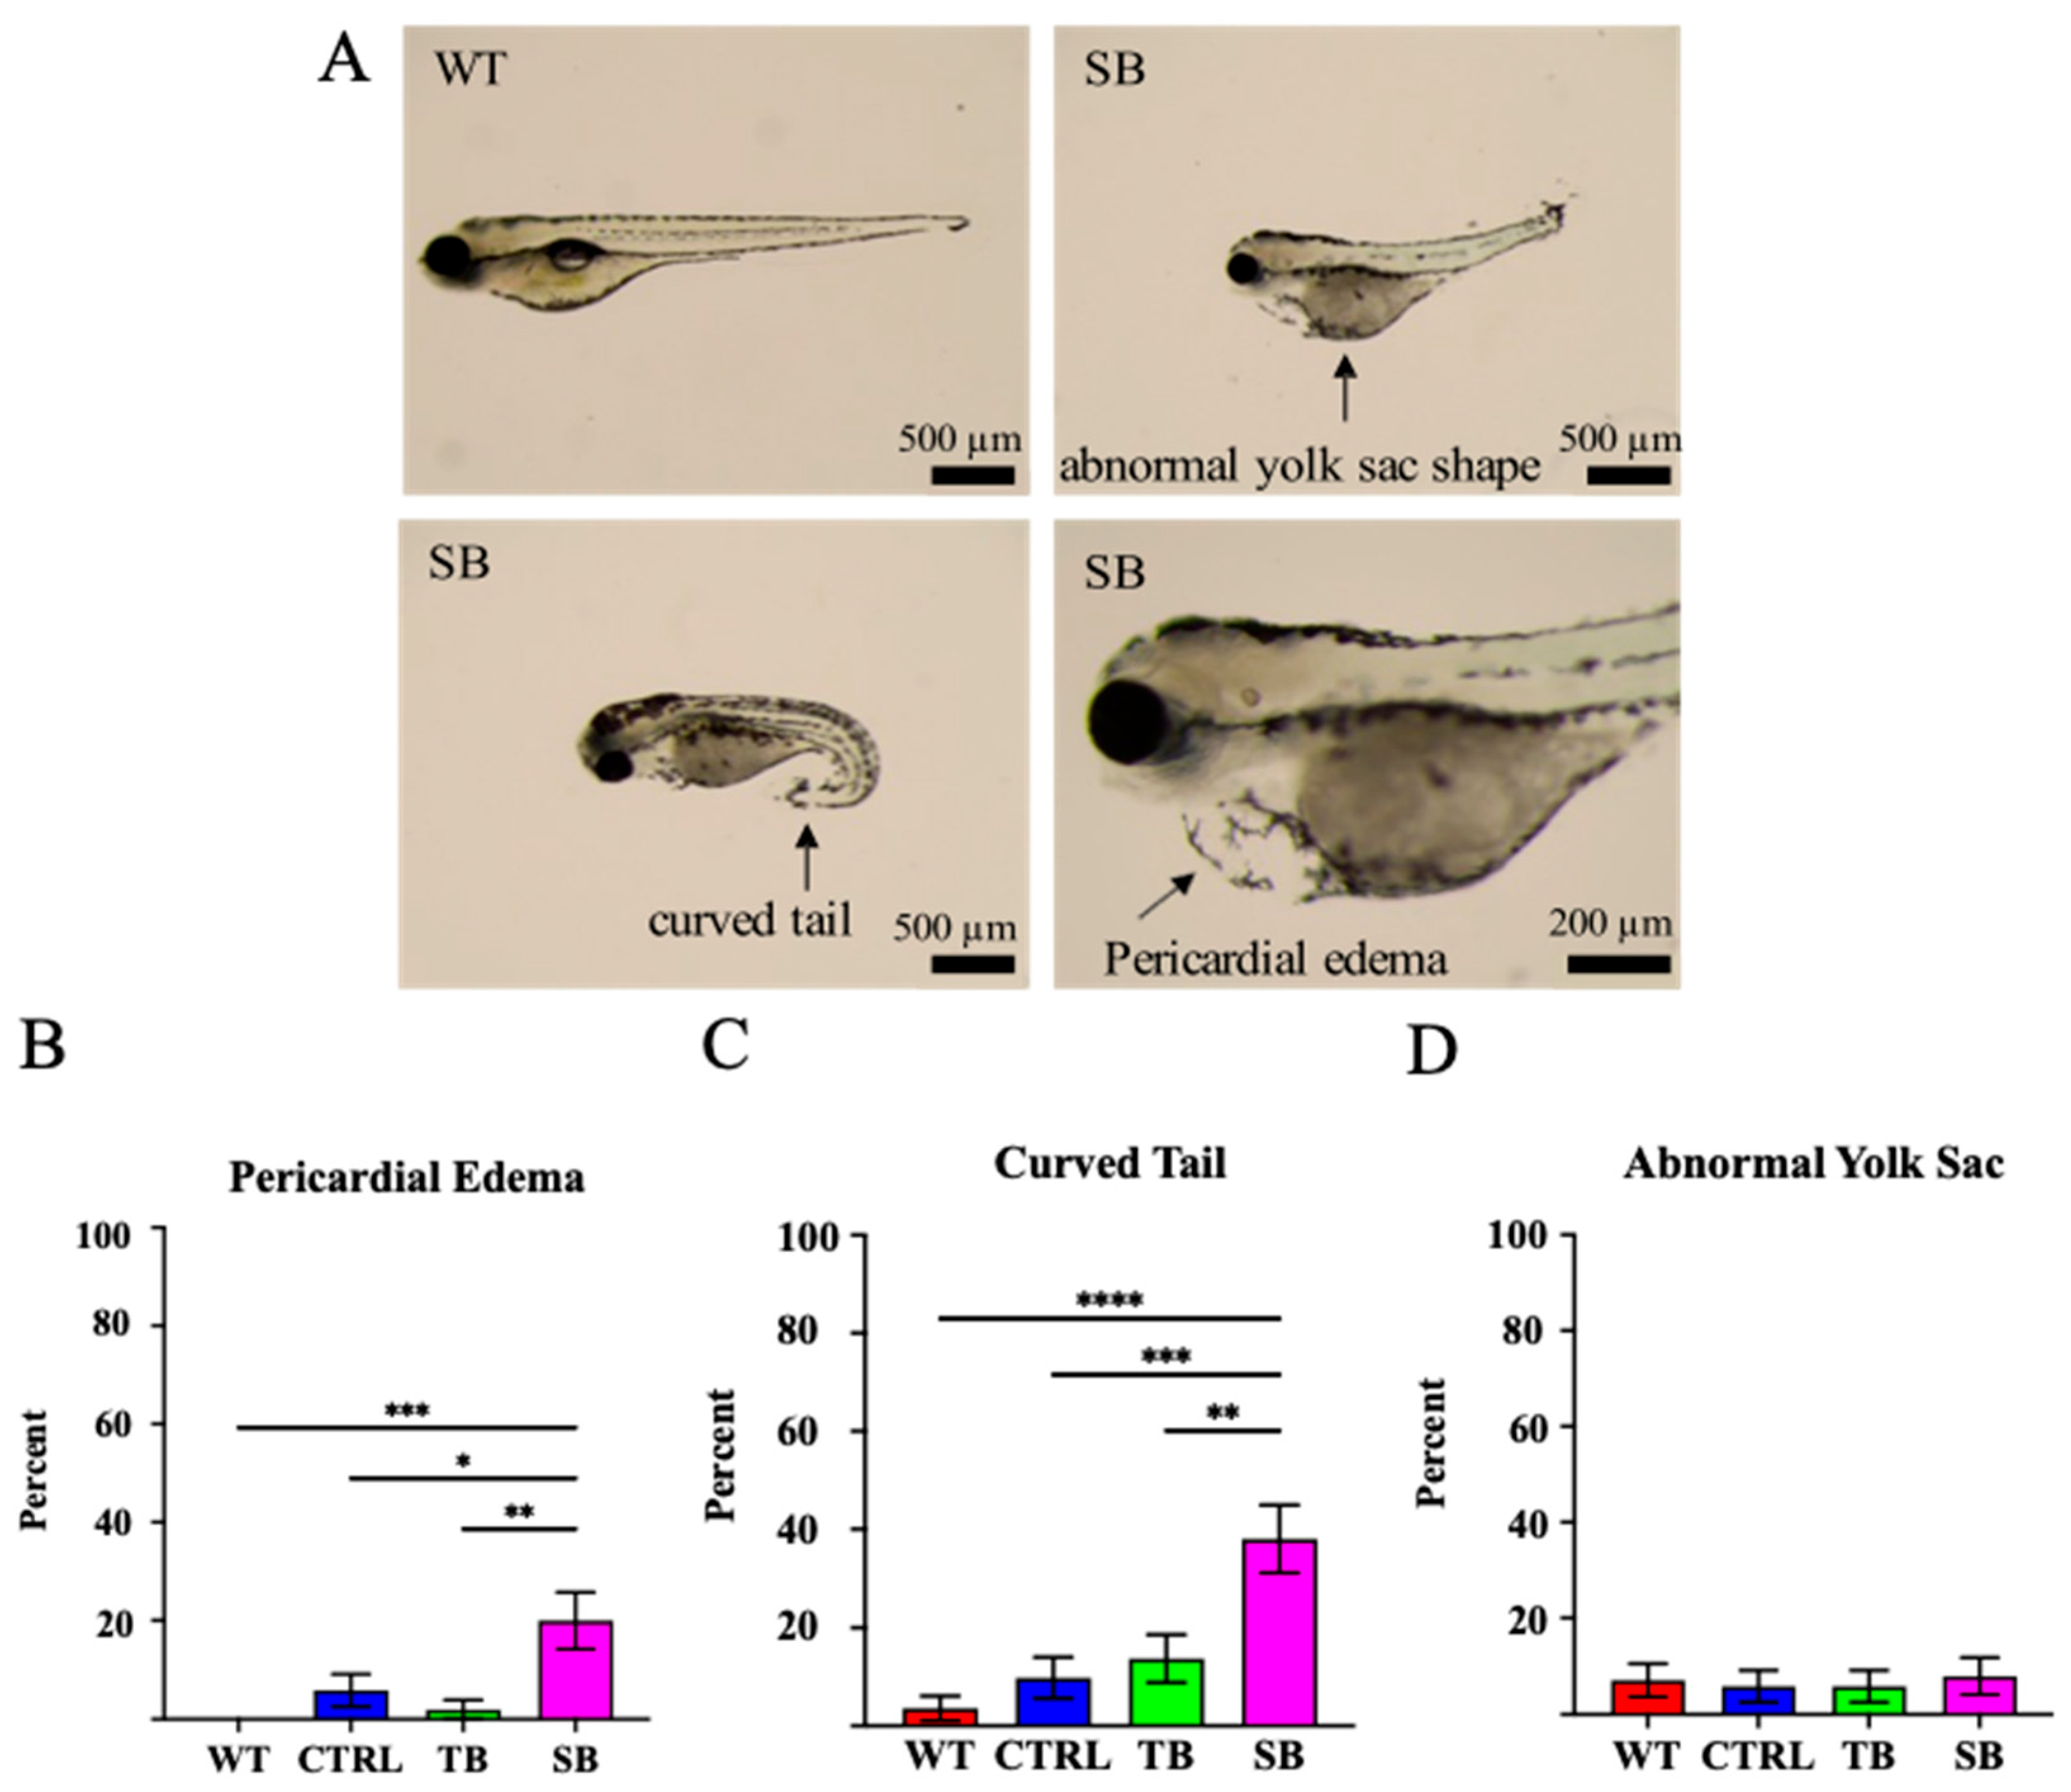
Fig. 3 Phenotypic assessment of CPT2 knockdown larvae. (A). CPT2 knockdown larvae at 5 dpi presented with several predominant phenotypic differences such as pericardial edema, curved tail, and abnormal yolk sac shape. Representative images of SB-injected phenotypes (SB) and wildtype (WT) comparison are shown. Scale bar = 500 µm and 200 µm, respectively. (B–D). Percent of qualitative phenotypic differences was compared between conditions. (A–D). WT = wildtype zebrafish; CTRL = control, scrambled MO-injected zebrafish; TB = translation blocking MO-injected zebrafish; SB = splice blocking MO-injected zebrafish. N = 50 fish per condition. * p ≤ 0.05, ** p ≤ 0.01, *** p ≤ 0.001, **** p ≤ 0.0001. Error bars = SEM.