
|
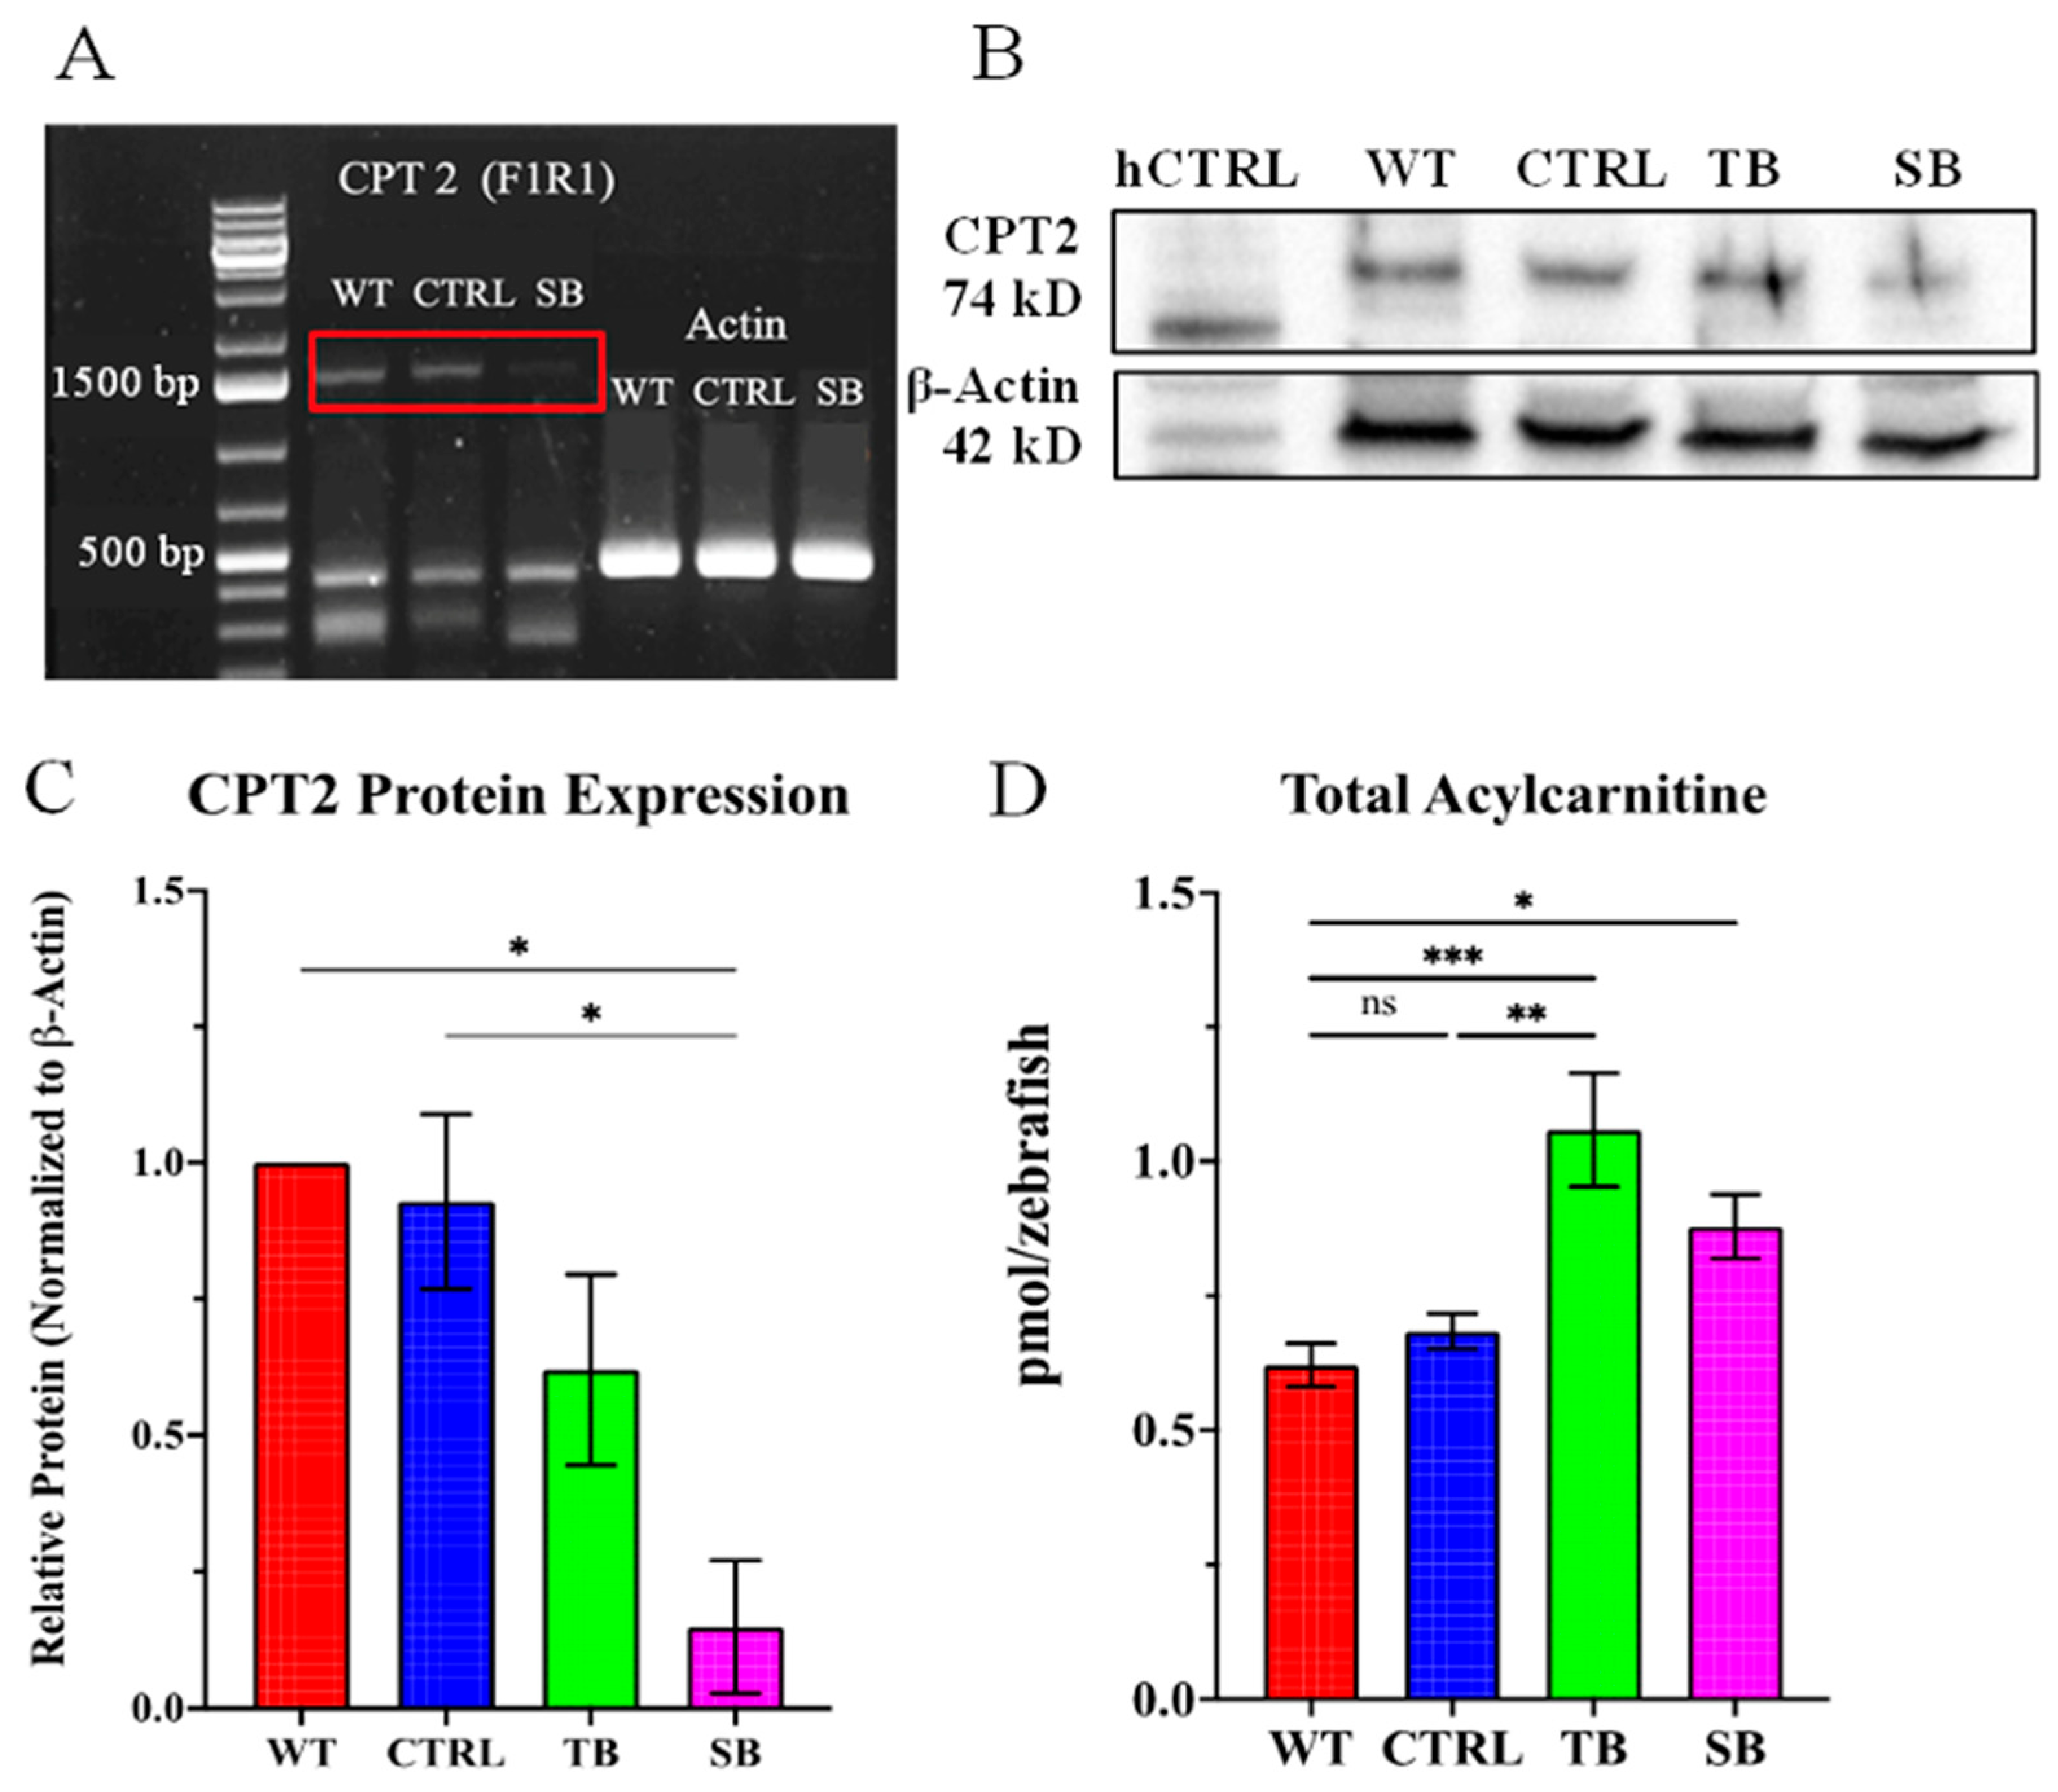
Fig. 2 Evaluation of morpholino CPT2 knockdown. (A). PCR amplification of full-length cpt2 run on 1% agarose gel. Actin was used as reference and control. N = 30 fish per condition. Red box indicates the expected cpt2 PCR product. (B). Representative Western blot for CPT2 expression in control and MO knockdown zebrafish. Human CPT2 lysate (hCPT2) was used as positive control. Actin was used as protein loading control. (C). CPT2 protein expression in MO knockdown zebrafish relative to WT. Protein levels were normalized to loading control β-actin. N = 200 fish per condition for each trial. Error bars = standard error of difference of 0.19 as determined by ordinary one-way ANOVA. (D). Total fatty-acylcarnitine expression evaluated using LC-MS/MS. N = 30 fish per condition for each of five trials. Error bars = SEM. (A–D). WT = wildtype zebrafish; CTRL = control, scrambled MO-injected zebrafish; TB = translation blocking MO-injected zebrafish; SB = splice blocking MO-injected zebrafish. * p ≤ 0.05, ** p ≤ 0.01, *** p ≤ 0.001, ns = not significant.