
Fig. 8
- ID
- ZDB-FIG-240903-88
- Publication
- Baker et al., 2024 - CPT2 Deficiency Modeled in Zebrafish: Abnormal Neural Development, Electrical Activity, Behavior, and Schizophrenia-Related Gene Expression
- Other Figures
- All Figure Page
- Back to All Figure Page
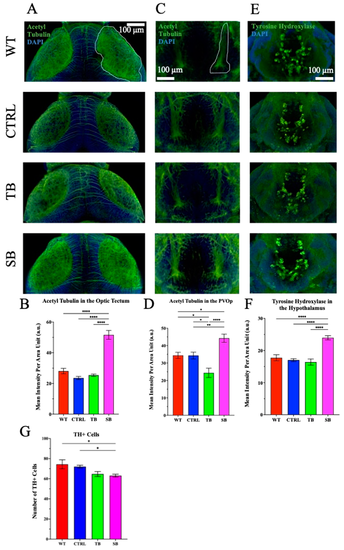
Immunofluorescence of neuronal network structure in CPT2 knockdown larvae brains. Brains were labeled with acetylated tubulin (green) and counterstained with DAPI. (A,B). The optic tectum is outlined in white and viewed on the dorsal side of the larvae. (C,D). The paraventricular organ posterior part (PVOp) region of the brain is outlined in white on the ventral side of the larvae. N = 8–16 per condition. (E,F). Brains were immunostained for tyrosine hydroxylase (green) and DAPI. The hypothalamus on the ventral side of the larva brain is shown. (G). Tyrosine hydroxylase-positive cells were counted from the hypothalamus. (A,C,E). Scale bar = 100 µm. (A–G). WT = wildtype, CTRL = control MO, TB = translation blocking MO, SB = splice blocking MO. N = 8–10 zebrafish brains per condition. * p ≤ 0.05, ** p < 0.01, **** p < 0.0001. Error bars = SEM |