
Image
|
Figure Caption
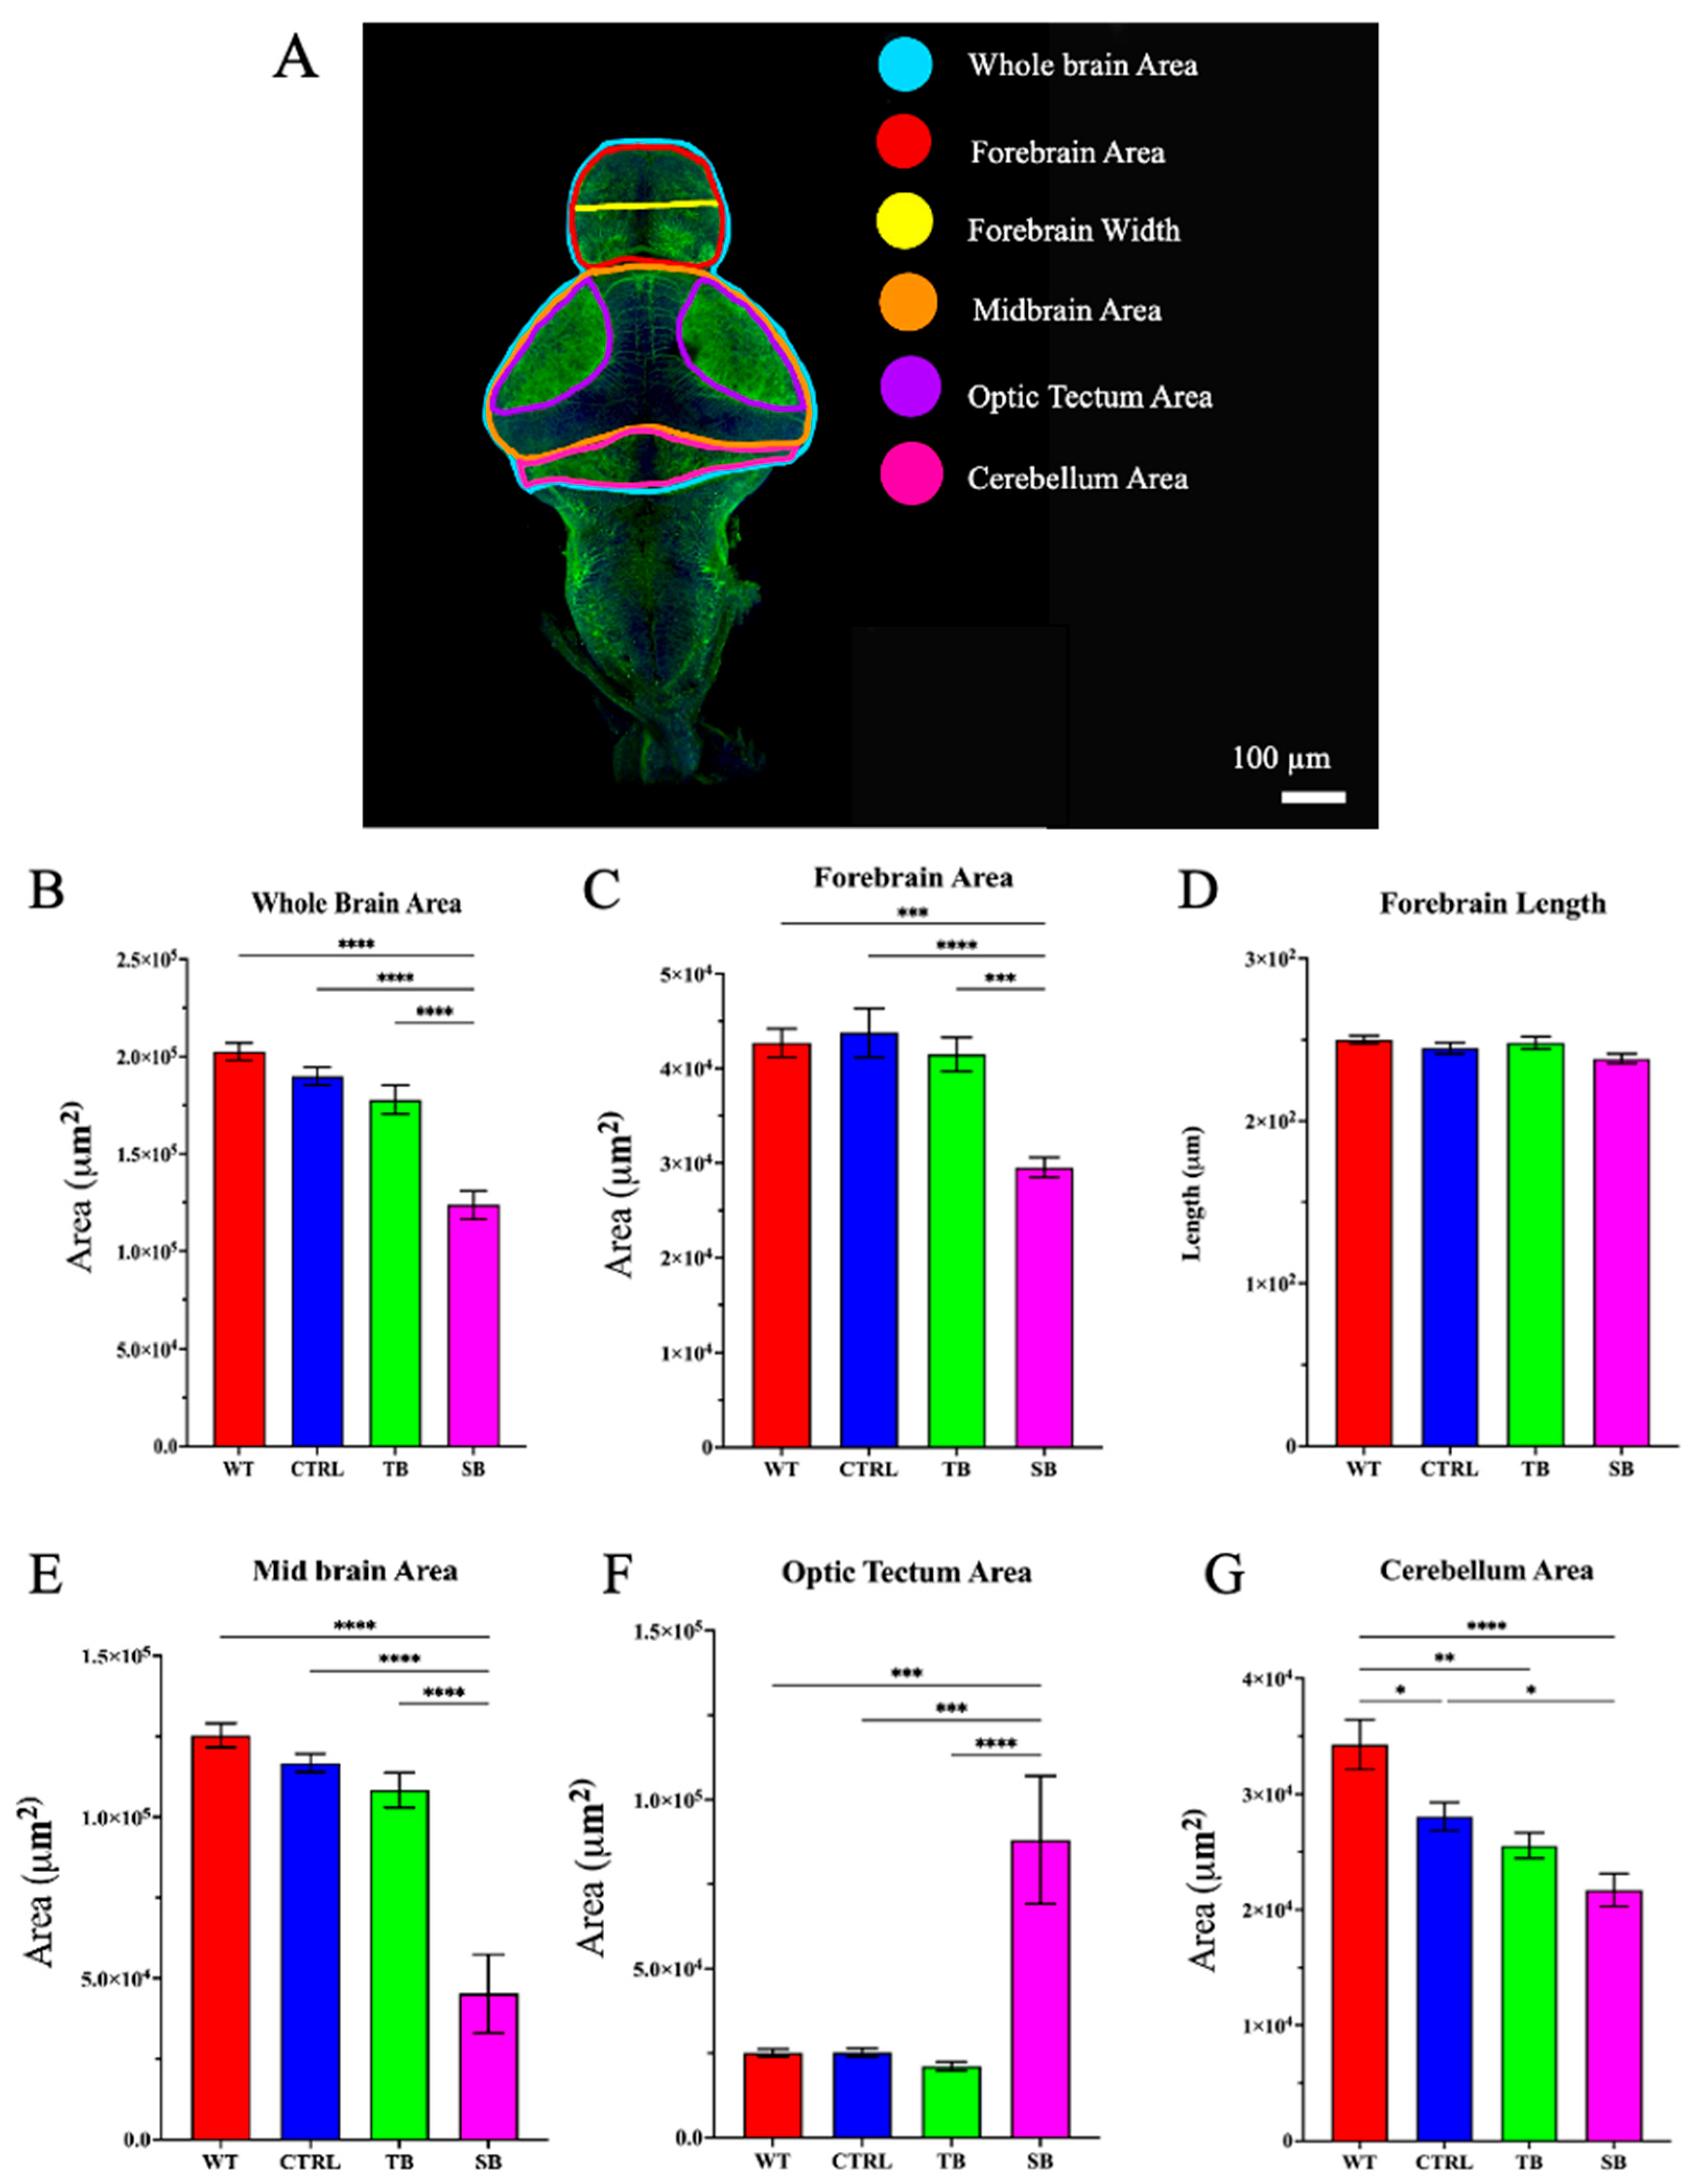
Fig. 7 Brain development in CPT2 knockdown larvae. (A). Dissected zebrafish brain immunostained with acetylated tubulin. Schematic map of brain regions that were measured. Scale bar = 100 µm. (B–G). Quantification of area and length measurements from dissected and acetylated tubulin-stained brains. WT = wildtype zebrafish; CTRL = control, scrambled MO-injected zebrafish; TB = translation blocking MO-injected zebrafish; SB = splice blocking MO-injected zebrafish. N = 8–16 zebrafish brains per condition. * p ≤ 0.05, ** p < 0.01, *** p < 0.001, **** p < 0.0001. Error bars = SEM.
Acknowledgments
This image is the copyrighted work of the attributed author or publisher, and
ZFIN has permission only to display this image to its users.
Additional permissions should be obtained from the applicable author or publisher of the image.
Full text @ Biomolecules