
|
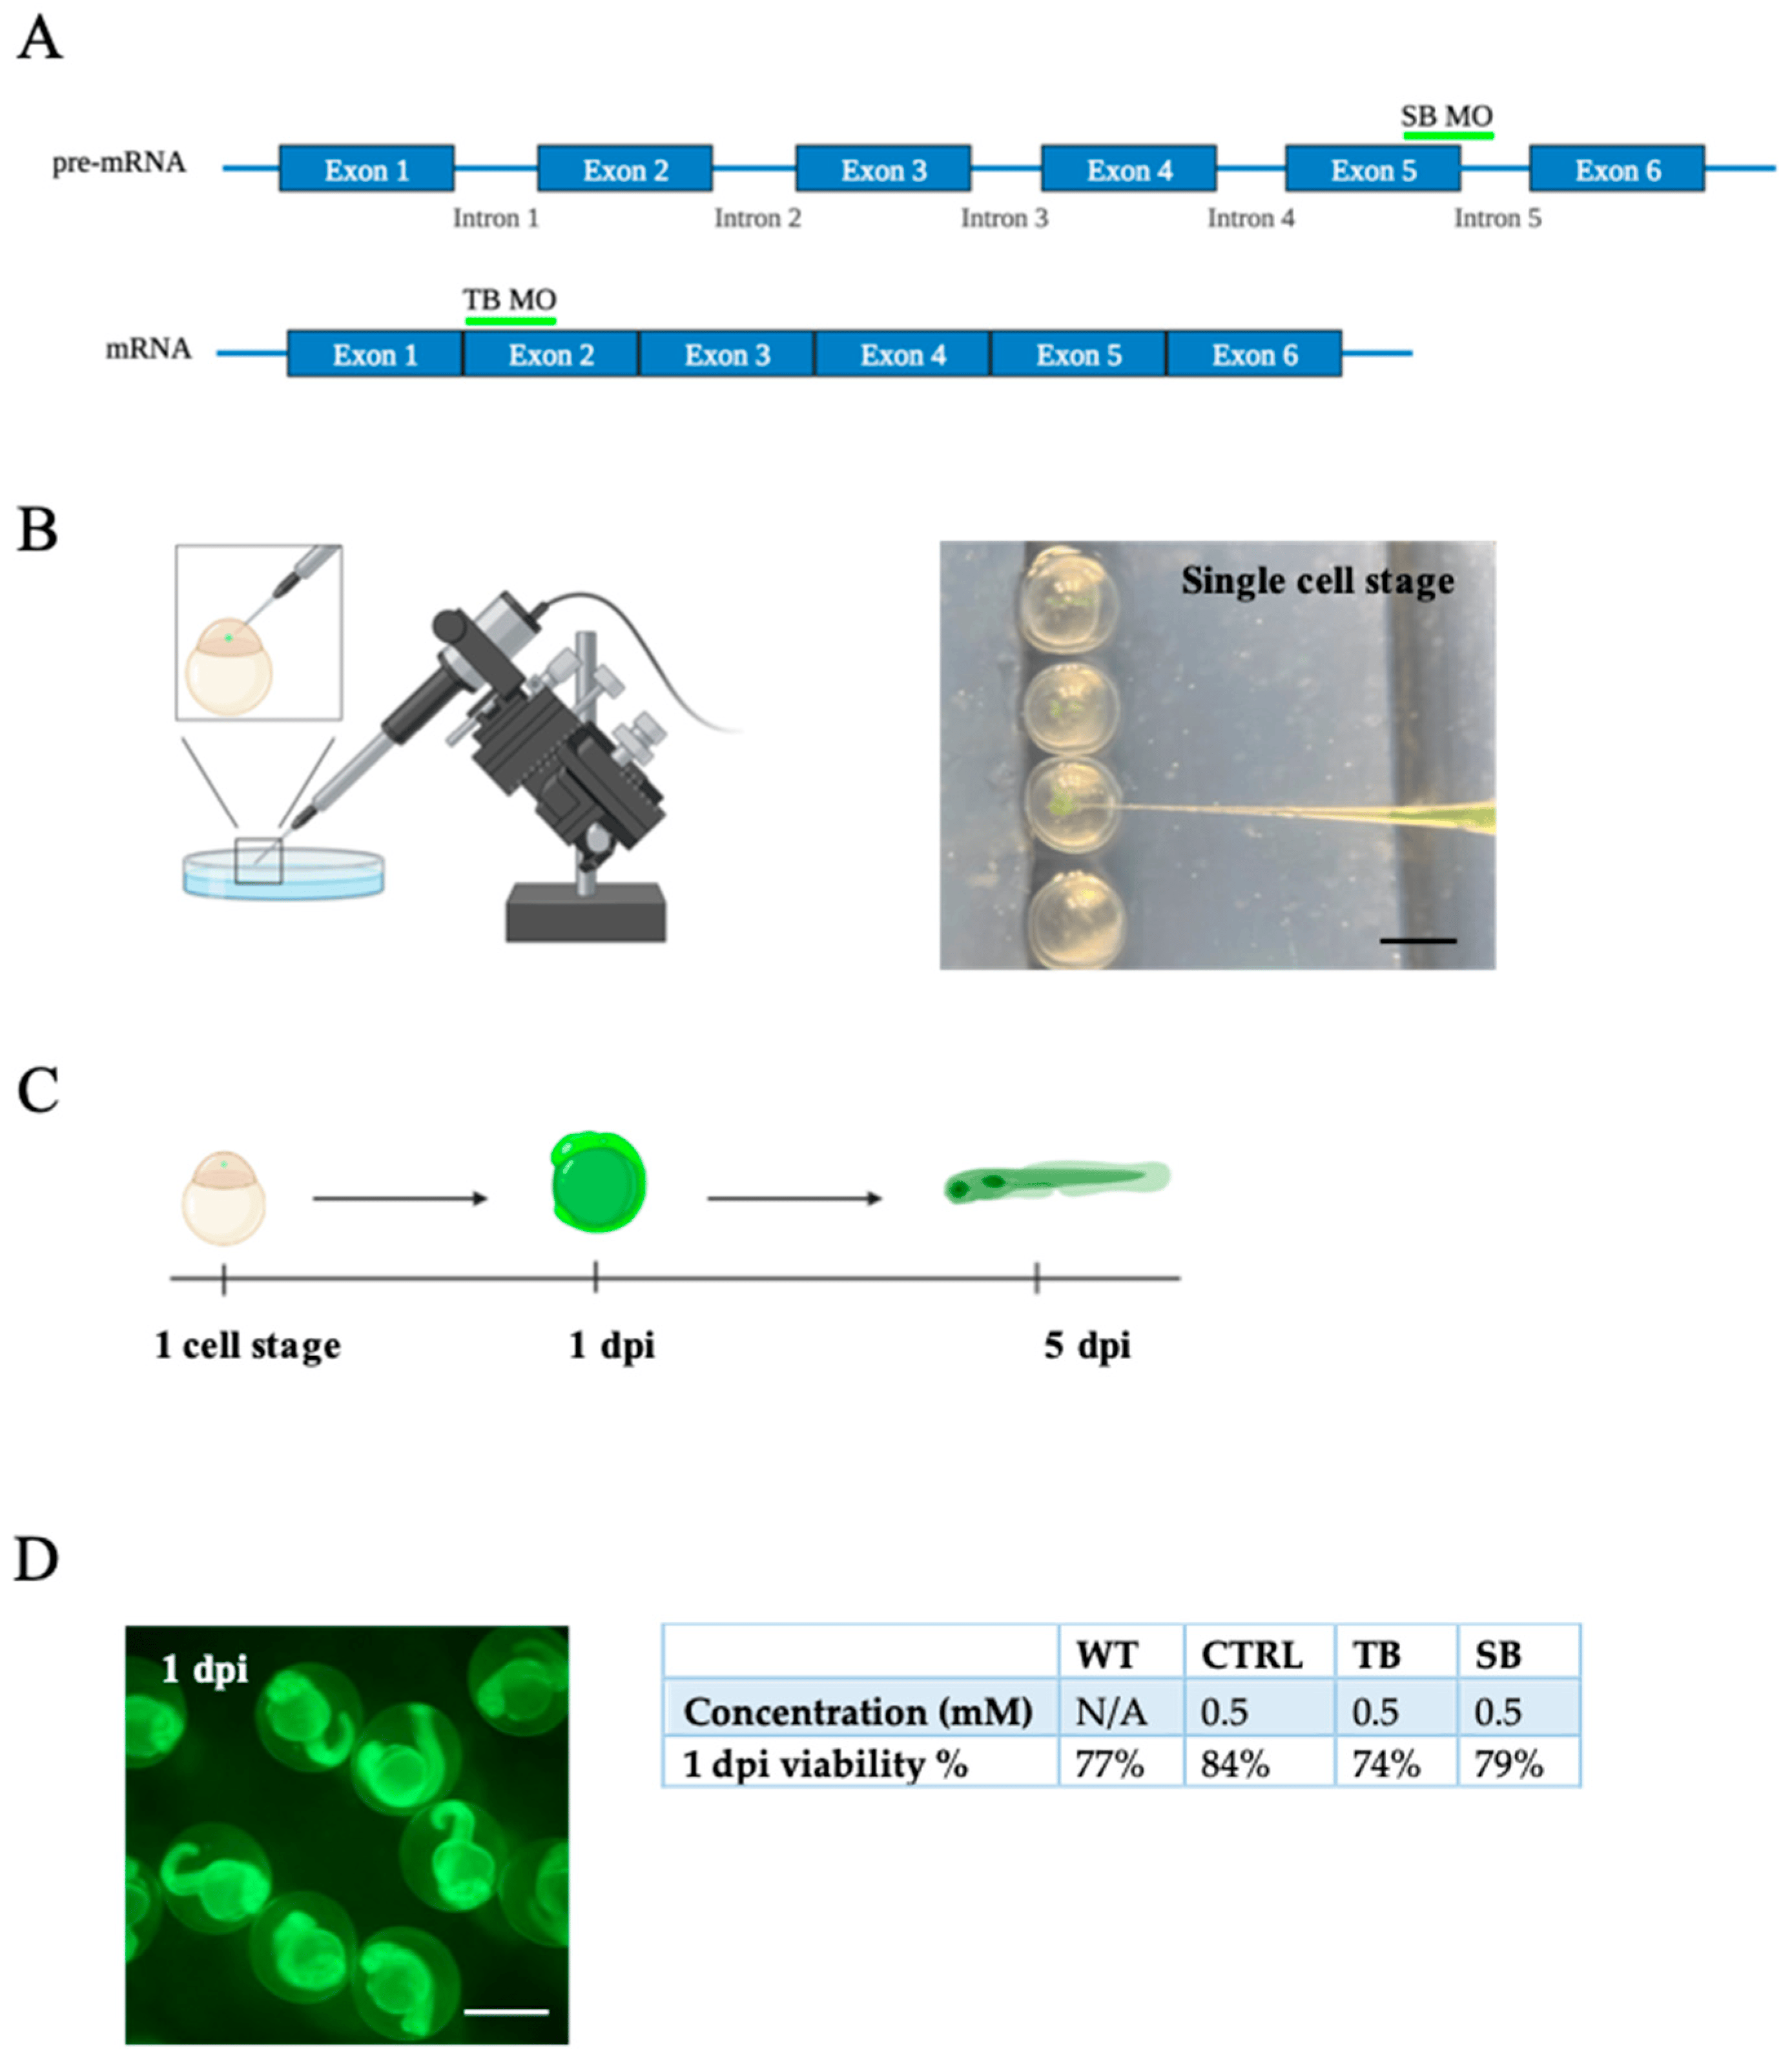
Fig. 1 Generation of vertebrate CPT2 knockdown model system in zebrafish. (A). Morpholino binding site for splice blocking (SB) and translation blocking (TB) MOs on pre-mRNA and mature mRNA, respectively. (B). Graphic of embryos microinjected with fluorescein-labeled morpholino oligonucleotide (MO) at single-cell stage using Narishige injector. Phase bright image of embryos being microinjected at the single-cell stage. (C). Timeline CPT2 knockdown model system following MO injection. At 1 dpi, embryos were screened for fluorescein. Viable embryos that were positive for fluorescein (fluorescein+) were raised to 5 dpi for all experiments to evaluate larval development. (D). Image of fluorescein+ embryos at 1 dpi. Percent viability of fluorescein+ embryos at 1 dpi compared to uninjected WT zebrafish. N = 15–48 fish per condition for each of three trials. WT = wildtype zebrafish; CTRL = control, scrambled MO-injected zebrafish; TB = translation blocking MO-injected zebrafish; and SB = splice blocking MO-injected zebrafish. (A–C). Images were designed using BioRender.com (Toronto, ON, Canada). Scale bar = 0.5 mm.