
Fig. 6
- ID
- ZDB-FIG-240903-86
- Publication
- Baker et al., 2024 - CPT2 Deficiency Modeled in Zebrafish: Abnormal Neural Development, Electrical Activity, Behavior, and Schizophrenia-Related Gene Expression
- Other Figures
- All Figure Page
- Back to All Figure Page
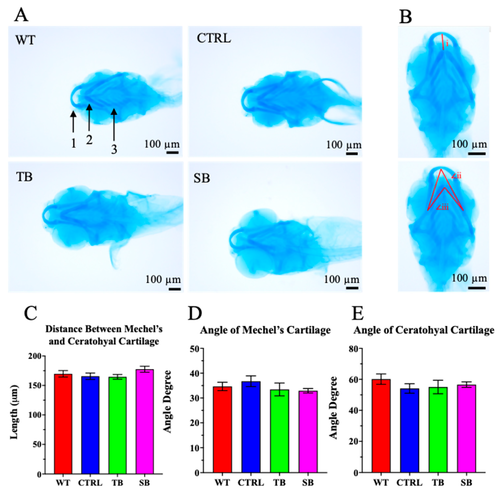
Cartilage development in CPT2 knockdown larvae. (A). Alcian blue stain was performed on 5 dpi larvae to evaluate cartilage development. Areas of focus were Mechel’s cartilage (1), ceratohyal cartilage (2), and ceratobranchial cartilage i–v (3). Scale bar = 100 µm. (B). Cartilage development was assessed on distance between Mechel’s and ceratohyal cartilage (i), angle of Mechel’s cartilage (∠ii), and angle of ceratohyal cartilage (∠iii). (C,D). Quantification of cartilage measurements. (A–E). WT = wildtype; CTRL = control, scrambled MO-injected fish; TB = translation blocking MO-injected zebrafish; SB = splice blocking MO. N ≤ 11 zebrafish per condition. Error bars = SEM. |