
|
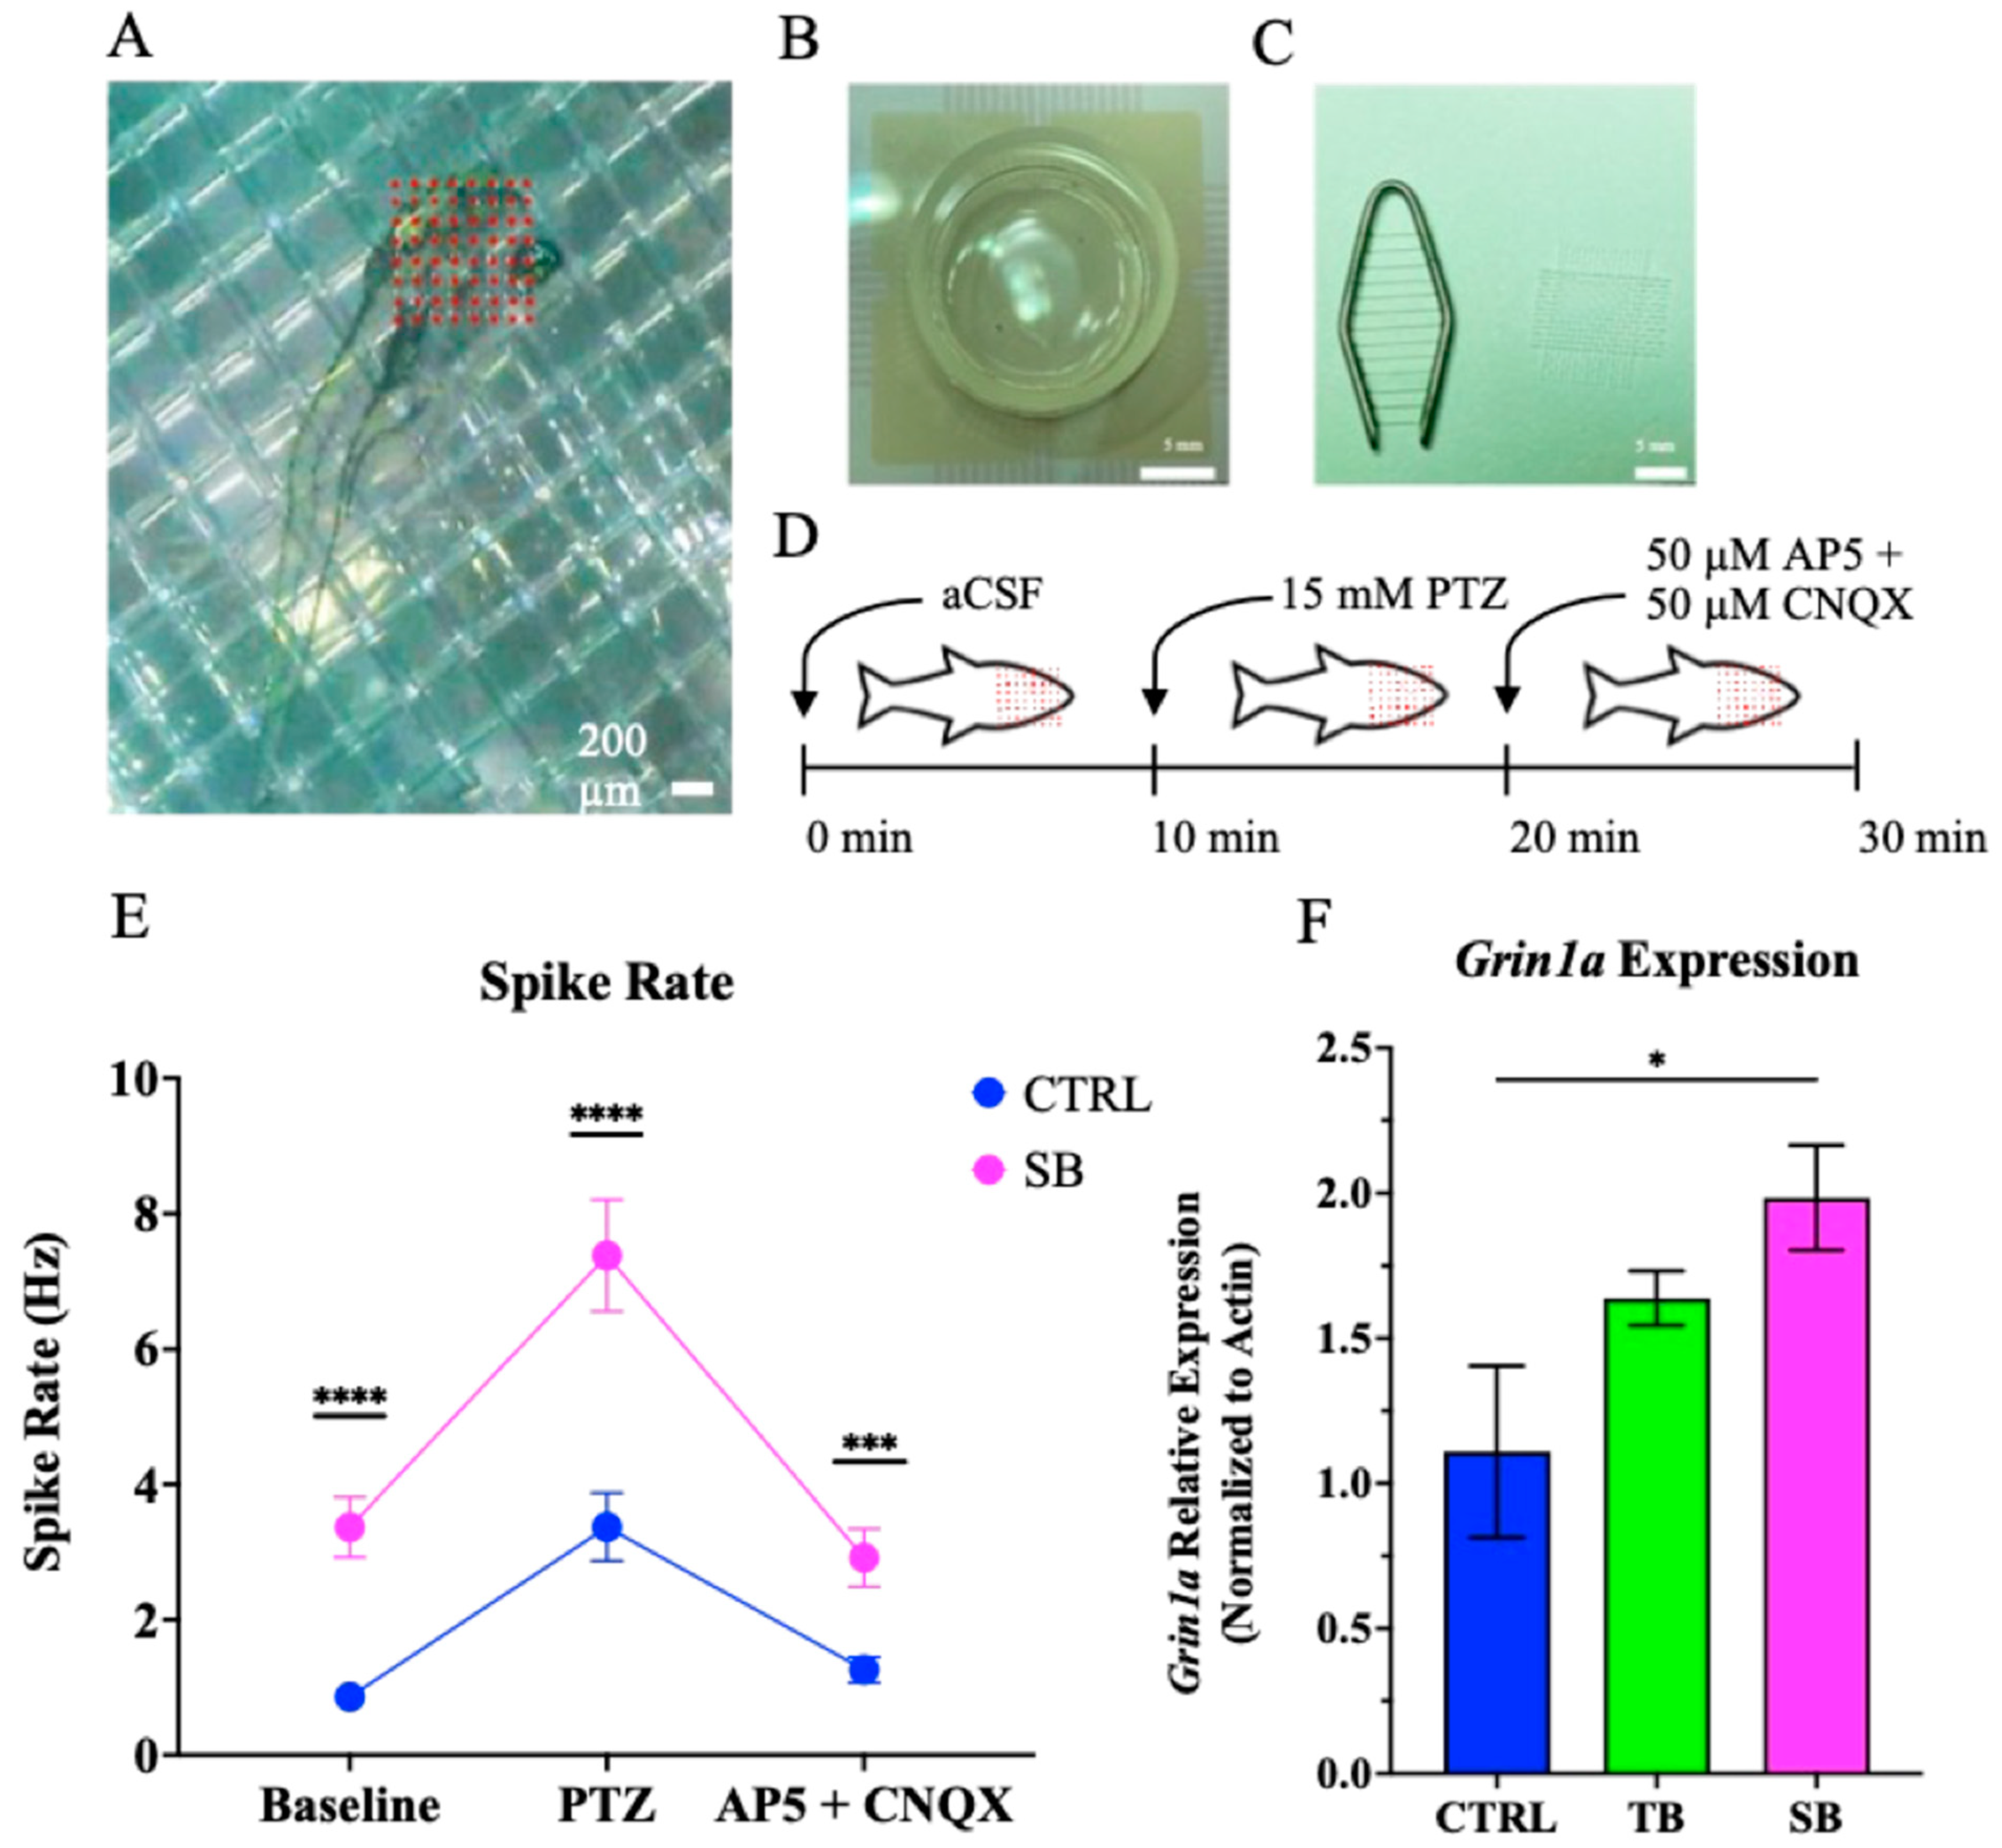
Fig. 11 Seizure susceptibility and Grin1a expression. (A). Secured, living 5 dpi zebrafish on MED64 electrode. Scale bar = 200 µm. (B). MED64 electrode dish. Scale bar = 5 mm. (C). Tissue harp and mesh for securing larvae to electrode. Scale bar = 5 mm. (D). Schematic of 30 min electrophysiology recording, 10 min of artificial cerebrospinal fluid (aCSF) perfusion, 10 min of Pentylenetetrazol (PTZ) perfusion, and 10 min of 2(R)-amino-5-phosphonopentanoate and cyanquixaline (AP5 + CNQX) perfusion. (E). Spike rate (Hz) of CTRL and SB larvae. N = 3 zebrafish per condition. (F). Grin1a gene expression evaluated through RT-qPCR. N = 30 fish per condition for each of four trials. (E–F). CTRL = control MO, TB = translation blocking MO, SB = splice blocking MO. * p ≤ 0.05, *** p < 0.001, **** p < 0.0001. Error bars = SEM.