
- Title
-
The proteasome subunit psmb1 is essential for craniofacial cartilage maturation and morphogenesis
- Authors
- Miller, B.M., Goessling, W.
- Source
- Full text @ JCI Insight
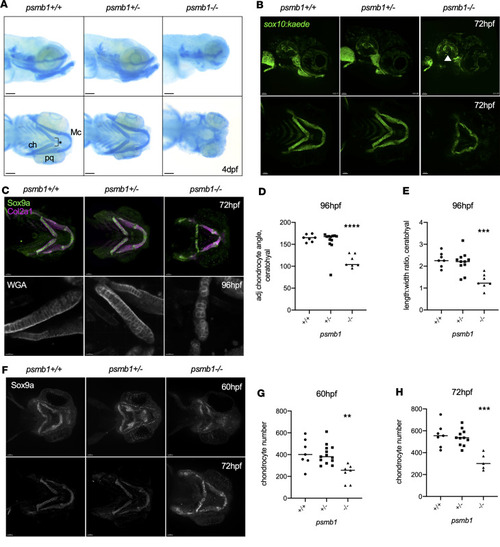
Failure of chondrocyte convergent extension in ( PHENOTYPE:
|
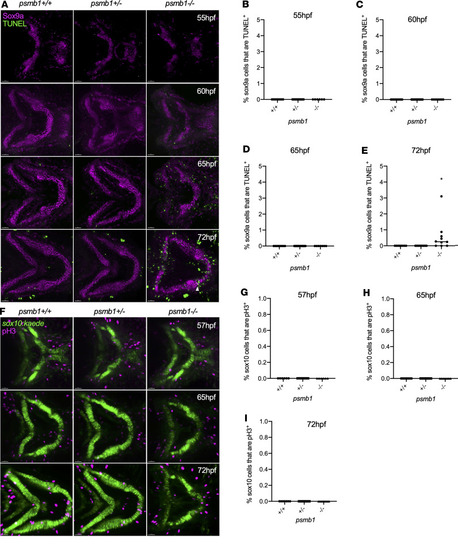
Chondrocyte cell death and proliferation in ( PHENOTYPE:
|
( |
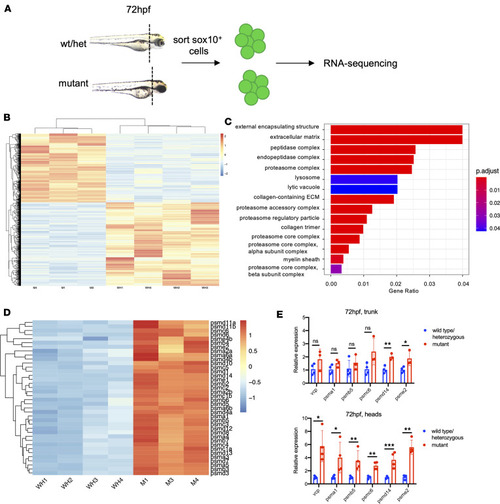
Proteasome subunit genes are upregulated in a tissue-specific fashion in ( |
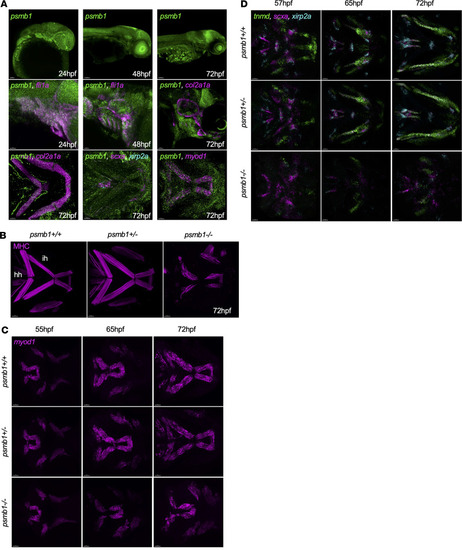
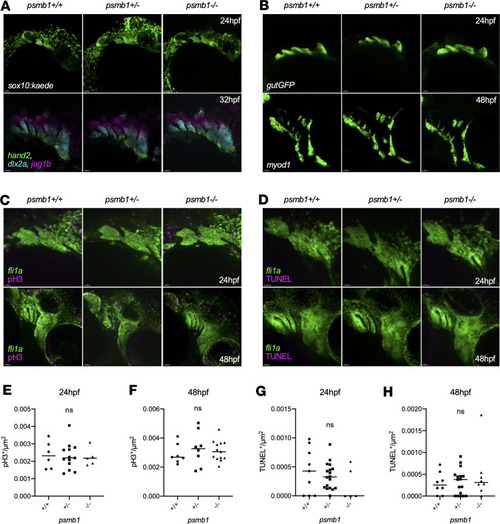
Craniofacial muscle and tendon defects in ( EXPRESSION / LABELING:
PHENOTYPE:
|
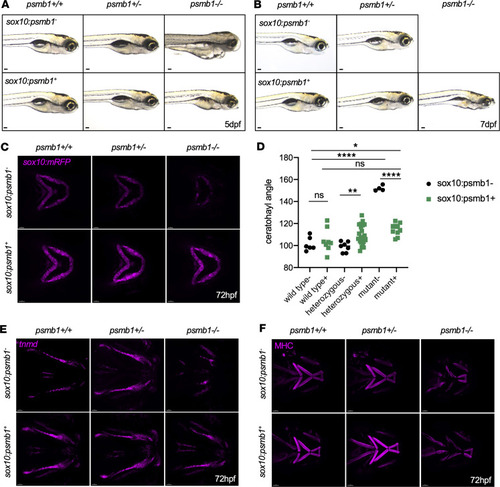
Overexpression of ( |

ZFIN is incorporating published figure images and captions as part of an ongoing project. Figures from some publications have not yet been curated, or are not available for display because of copyright restrictions. EXPRESSION / LABELING:
PHENOTYPE:
|
|
ZFIN is incorporating published figure images and captions as part of an ongoing project. Figures from some publications have not yet been curated, or are not available for display because of copyright restrictions. EXPRESSION / LABELING:
PHENOTYPE:
|
|
ZFIN is incorporating published figure images and captions as part of an ongoing project. Figures from some publications have not yet been curated, or are not available for display because of copyright restrictions. EXPRESSION / LABELING:
PHENOTYPE:
|