IMAGE

Figure 2

ID
ZDB-IMAGE-240826-4
Source
Figures for Miller et al., 2024
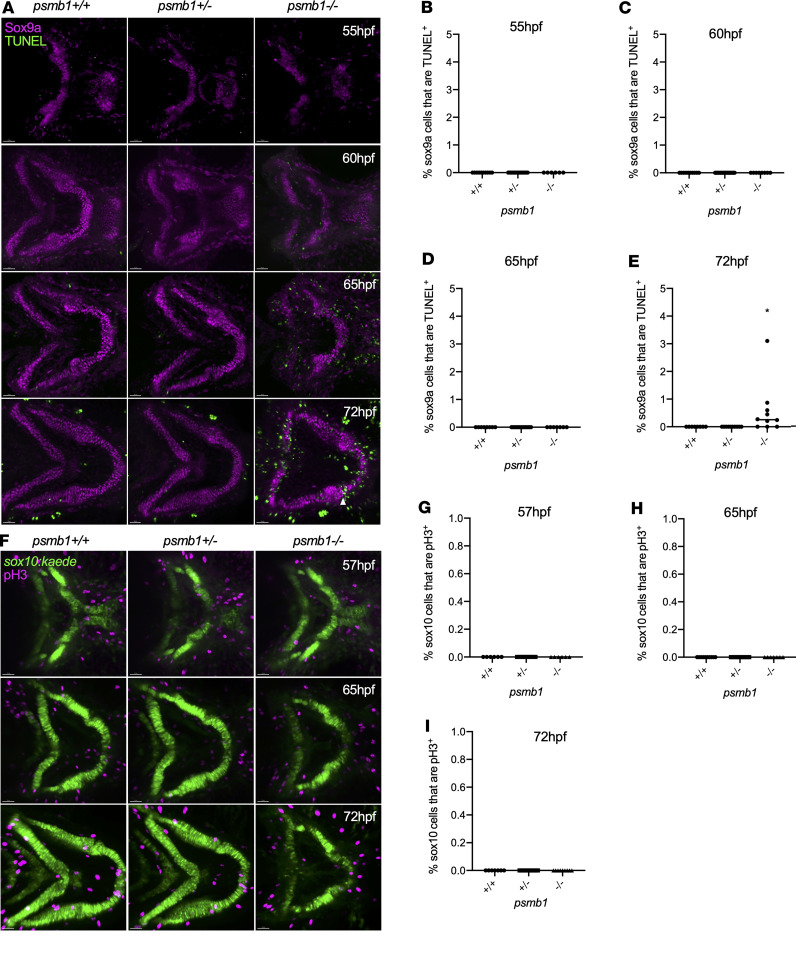
Image
Figure Caption

Figure 2 Chondrocyte cell death and proliferation in psmb1 mutants.

(A) Time-course study of apoptag TUNEL staining (green) and Sox9a staining (magenta) from 55–72 hpf. (BE) Quantification of A demonstrates that cell death is not elevated in mutant chondrocytes until 72 hpf, at which point sox9a+TUNEL+ cells can be found (white arrowhead). 55 hpf: n = 10 (+/+), 16 (+/–), 6 (–/–). 60 hpf: n = 10 (+/+), 21 (+/–), 8 (–/–). 65 hpf: n = 6 (+/+), 6 (+/–), 6 (–/–). 72 hpf: n = 8 (+/+), 10 (+/–), 10 (–/–). (F) pH3 (magenta) antibody staining in sox10:kaede larvae (green) at 57 hpf, 65 hpf, and 72 hpf. (GI) Quantification of C shows no proliferation of craniofacial chondrocytes across genotypes. 57 hpf: n = 6 (+/+), 10 (+/–), 6 (–/–). 65 hpf: n = 10 (+/+), 14 (+/–), 7 (–/–). 72 hpf: n = 7 (+/+), 11 (+/–), 9 (–/–). Scale bars: 50 μm. Data shown represent mean ± SD. Significance was calculated with 1-way ANOVA with Dunnett’s multiple comparisons test. *P < 0.05; ns, not significant.

Figure Data
Acknowledgments
This image is the copyrighted work of the attributed author or publisher, and ZFIN has permission only to display this image to its users. Additional permissions should be obtained from the applicable author or publisher of the image. Full text @ JCI Insight