IMAGE

Figure 1

ID
ZDB-IMAGE-240826-3
Source
Figures for Miller et al., 2024
Image
Figure Caption

Figure 1 
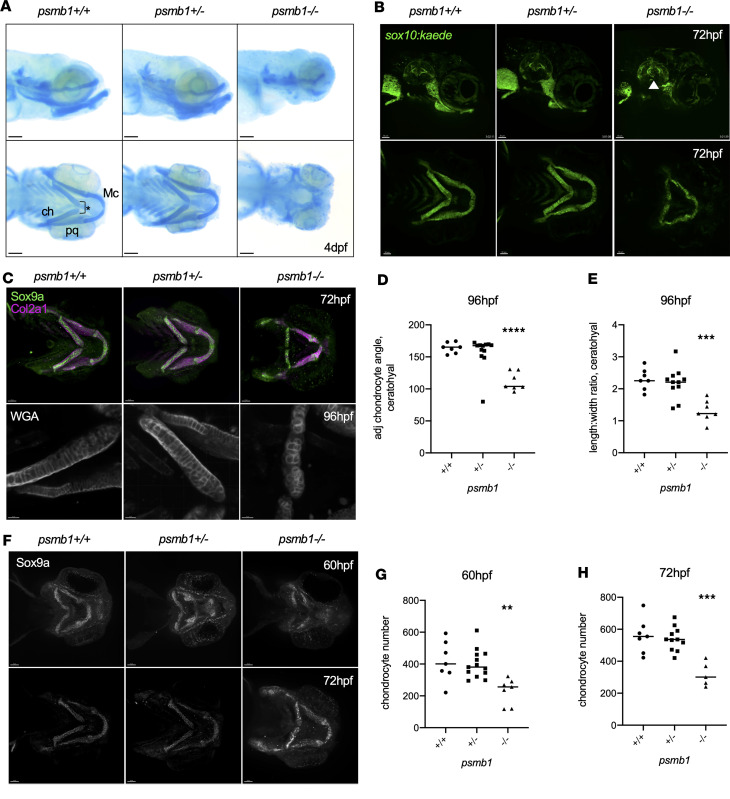
Failure of chondrocyte convergent extension in psmb1 mutants.

(A) Alcian blue staining of 4 dpf psmb1 larvae. Mc, Meckel’s cartilage; ch, ceratohyal; pq, palatoquadrate. The asterisk indicates ceratohyal angle. Scale bars: 100 μm. (B) Imaging of sox10:kaede; psmb1–/– larvae at 72 hpf demonstrates defects in first and second arch cartilage derivatives as well as semicircular canal formation (white arrowhead). Scale bars: 50 μm. (C) Col2a1 (magenta) and Sox9a (green) antibody staining of psmb1 larvae at 72 hpf (top, scale bars: 50 μm) and wheat germ agglutinin stain at 96 hpf (bottom, scale bars: 30 μm). (D) Quantification of chondrocyte stacking in wheat germ agglutinin stain images via analysis of the angle formed by drawing a line through 3 adjacent chondrocytes. n = 7 (+/+), 12 (+/–), 7 (–/–). (E) Quantification of chondrocyte stacking in wheat germ agglutinin stain images by analysis of length/width ratio. n = 7 (+/+), 12 (+/–), 7 (–/–). (F) Antibody stain for Sox9a at 60 hpf and 72 hpf. Scale bars: 50 μm. (G) Quantification of the number of chondrocytes present in the ceratohyal, palatoquadrate, and Meckel’s cartilages at 60 hpf in images in F. n = 7 (+/+), 13 (+/–), 7 (–/–). (H) Quantification of the number of chondrocytes present in the ceratohyal, palatoquadrate, and Meckel’s cartilages at 72 hpf in images in F. n = 7 (+/+), 11 (+/–), 5 (–/–). Data shown represent mean ± SD. Significance was calculated with 1-way ANOVA with Dunnett’s multiple comparisons test, **P ≤ 0.01, ***P ≤ 0.001, ****P ≤ 0.0001.

Figure Data
Acknowledgments
This image is the copyrighted work of the attributed author or publisher, and ZFIN has permission only to display this image to its users. Additional permissions should be obtained from the applicable author or publisher of the image. Full text @ JCI Insight