IMAGE

Figure 4

ID
ZDB-IMAGE-240826-6
Source
Figures for Miller et al., 2024
Image
Figure Caption

Figure 4 
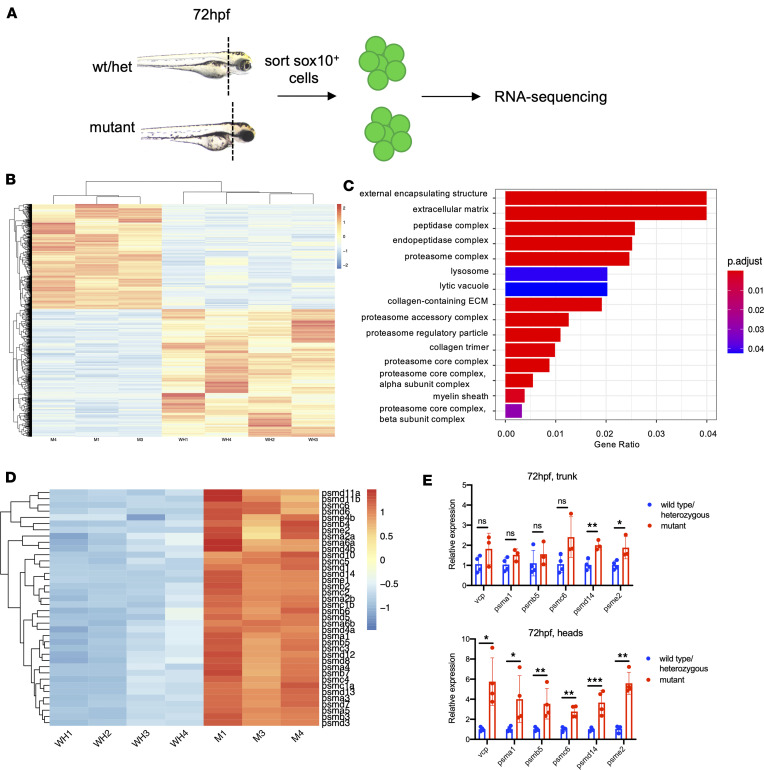
Proteasome subunit genes are upregulated in a tissue-specific fashion in psmb1 mutants.

(A) Schematic of RNA-Seq approach for cranial sox10+ cells from wild-type/heterozygous versus mutant fish at 72 hpf. (B) Heatmap of normalized counts of differentially expressed genes in cranial sox10+ cells at 72 hpf. Wald’s test with false discovery rate correction (P adjusted < 0.05). Each sample represents cells from 25 different larvae. (C) GO enrichment analysis using ClusterProfiler identifies GO components enriched in the differentially expressed gene set. (D) Heatmap of proteasome subunit gene expression in RNA-Seq data set from sorted cranial sox10+ cells (E) Top: qRT-PCR for proteasome subunit genes on cDNA from dissected trunks/tails at 72 hpf. Bottom: qRT-PCR for proteasome subunit genes on cDNA from dissected heads at 72 hpf. WH, pooled wild-type/heterozygous larvae; M, mutant larvae. Data shown represent mean ± SD. Significance was calculated with unpaired t test. *P < 0.05, **P < 0.01, ***P < 0.001, ****P < 0.0001.

Acknowledgments
This image is the copyrighted work of the attributed author or publisher, and ZFIN has permission only to display this image to its users. Additional permissions should be obtained from the applicable author or publisher of the image. Full text @ JCI Insight