|
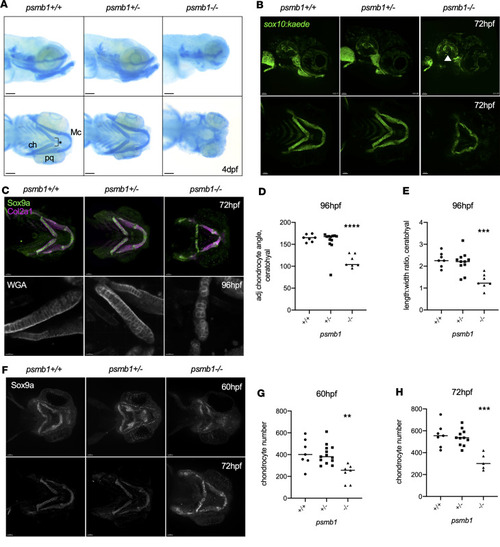
Failure of chondrocyte convergent extension in psmb1 mutants. (A) Alcian blue staining of 4 dpf psmb1 larvae. Mc, Meckel’s cartilage; ch, ceratohyal; pq, palatoquadrate. The asterisk indicates ceratohyal angle. Scale bars: 100 μm. (B) Imaging of sox10:kaede; psmb1–/– larvae at 72 hpf demonstrates defects in first and second arch cartilage derivatives as well as semicircular canal formation (white arrowhead). Scale bars: 50 μm. (C) Col2a1 (magenta) and Sox9a (green) antibody staining of psmb1 larvae at 72 hpf (top, scale bars: 50 μm) and wheat germ agglutinin stain at 96 hpf (bottom, scale bars: 30 μm). (D) Quantification of chondrocyte stacking in wheat germ agglutinin stain images via analysis of the angle formed by drawing a line through 3 adjacent chondrocytes. n = 7 (+/+), 12 (+/–), 7 (–/–). (E) Quantification of chondrocyte stacking in wheat germ agglutinin stain images by analysis of length/width ratio. n = 7 (+/+), 12 (+/–), 7 (–/–). (F) Antibody stain for Sox9a at 60 hpf and 72 hpf. Scale bars: 50 μm. (G) Quantification of the number of chondrocytes present in the ceratohyal, palatoquadrate, and Meckel’s cartilages at 60 hpf in images in F. n = 7 (+/+), 13 (+/–), 7 (–/–). (H) Quantification of the number of chondrocytes present in the ceratohyal, palatoquadrate, and Meckel’s cartilages at 72 hpf in images in F. n = 7 (+/+), 11 (+/–), 5 (–/–). Data shown represent mean ± SD. Significance was calculated with 1-way ANOVA with Dunnett’s multiple comparisons test, **P ≤ 0.01, ***P ≤ 0.001, ****P ≤ 0.0001.
|