FIGURE SUMMARY
Title

Examining the liver-pancreas crosstalk reveals a role for the molybdenum cofactor in β-cell regeneration

Authors
Karampelias, C., Băloiu, B., Rathkolb, B., da Silva-Buttkus, P., Bachar-Wikström, E., Marschall, S., Fuchs, H., Gailus-Durner, V., Chu, L., Hrabě de Angelis, M., Andersson, O.
Source
Full text @ Life Sci Alliance

Hepatocytes’ contribution to the spontaneous β-cell regeneration in zebrafish.

(A) Schema showing the lineage-tracing approach to characterize the hepatocyte-to-β-cell reprogramming using the Tg(fabp10a:Cre);Tg(ubi:Switch) zebrafish. Blue arrowheads indicate the loxP sites. (B, B′) Single-plane confocal images of the Tg(fabp10a:Cre);Tg(ins:flag-NTR);Tg(ubi:switch) pancreas (B) and liver (B′) of 6 dpf zebrafish larvae after 2 d of β-cell regeneration immunostained against insulin. The white dashed line outlines the pancreas, and the magenta dashed line outlines the border of the liver. Scale bar, 20 μm. n ≥ 10 larvae examined from two independent experiments. (C, C′, D, D′) Single-plane confocal images of liver and primary islets of Tg(fabp10a:Cre);Tg(ins:CFP-NTR);Tg(ubi:switch) 6 dpf larvae, with (C, C′) or without (D, D′) MTZ treatment, that is, β-cell ablation. Larvae in (C, C′) were left to regenerate their β-cells for 2 d. (C, C′, D, D′) White dashed line outlines the insets of the primary islet of the pancreas (C, D), and the magenta dashed line outlines the border of the liver (C′, D′). Scale bar, 20 μm. n ≥ 10 larvae examined from two independent replicates. (E, F, G, H, I) Maximum projections of livers from control (E), MTZ-treated (F), acetaminophen-treated (G), and Tg(ins:flag-NTR)+MTZ-treated (H) Tg(fabp10a:GFP) 4 dpf zebrafish larvae. Chemical treatments were carried out at 3–4 dpf. (I) Quantification showed a significant decrease in the hepatocyte area after hepatocyte damage or β-cell ablation (I). Scale bar, 20 μm. n = 8–10. Data are presented as the mean values ± SEM. One-way ANOVA was used to estimate statistical significance followed by a Holm–Šidák multiple comparison test. *P = 0.0325 (control versus acetaminophen); *P = 0.0237 (control versus Tg(ins:flag-NTR)+MTZ). (J, K, L) Representative maximum projections of pancreatic islets in control (J) and acetaminophen-treated (3–4 dpf) (K) 5 dpf zebrafish larvae immunostained against insulin. Nuclei were counterstained with TO-PRO-3. (L) Quantification of the insulin area (L). Scale bar, 10 μm. n = 10.

Transcriptomic changes in hepatocytes after β-cell ablation.

(A) Schema showing the experimental design to identify transcriptional changes in hepatocytes after β-cell ablation in 2-mo-old zebrafish. (B) Glucose measurements of the 2-mo-old zebrafish used for hepatocyte isolation. Measurements were made before liver dissection. n = 5–9. A Mann–Whitney test was used to assess significance. **P = 0.0045. (C) Log2 fold change plot showing the up-regulated and down-regulated genes in hepatocytes after β-cell ablation. The significantly differentially expressed genes (P adj < 0.05) are highlighted as red dots. (C, D, E, F) Statistical overrepresentation analysis of the down-regulated genes from (C) using the PantherDB tool. (D, E, F) Fold enrichment of the significantly enriched processes (D), molecular function (E), and Reactome pathways (F) is shown.

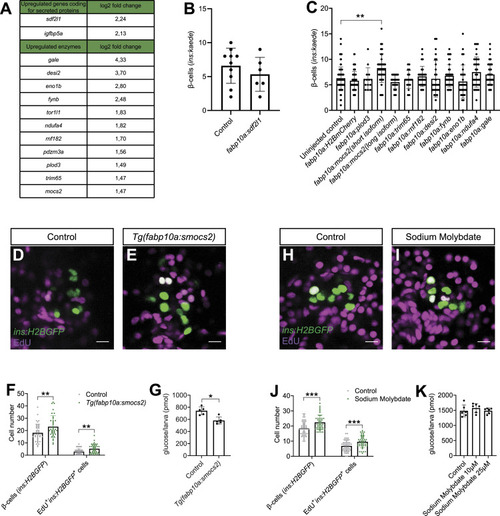
Genetic screen reveals a role for the molybdenum cofactor biosynthetic pathway in β-cell regeneration.

(A) Table showing the log2 fold changes of the significantly up-regulated genes encoding for secreted proteins and enzymes in hepatocytes after β-cell ablation. (B) Quantification of regenerated β-cells in 6 dpf Tg(ins:kaede);Tg(ins:CFP-NTR) larvae overexpressing sdf2l1 in hepatocytes. n = 6–10. Data are presented as mean values ± SEM. (A, C) Quantification of β-cells in control and zebrafish larvae injected at the one-cell stage with vectors driving the expression of the enzymes identified in hepatocytes (A) under the control of the fabp10a promoter (together with mRNA encoding the transposase enzyme to induce genomic integration). After injections, β-cells were ablated from 3 to 4 dpf and the β-cells were counted manually after 2 d of regeneration in the Tg(ins:kaede);Tg(ins:CFP-NTR) zebrafish larvae at 6 dpf. n = 14–104. Data for the control experiments were pooled from four independent experiments. If there was a positive hit in the first experiment, the experiments were repeated and data pooled in this graph. A Kruskal–Wallis test followed by Dunn’s multiple comparison test was used to assess statistical significance. **P = 0.0038. Data are presented as mean values ± SEM. (D, E, F) Single-plane confocal images of pancreatic islets of control (D) and Tg(fabp10a:smocs2) (E) Tg(ins:flag-NTR);Tg(ins:H2BGFP) 6 dpf zebrafish larvae after 2 d of β-cell regeneration, during which EdU incubation occurred. (F) Quantification of the number of ins:H2BGFP+ and ins:H2BGFP+EdU+ cells (F). Scale bar, 10 μm. n = 37–40. A Mann–Whitney test was used to assess significance. **P = 0.0079 and 0.0037, respectively. Data are presented as mean values ± SEM and are pooled from three independent experiments. (G) Glucose levels in Tg(ins:flag-NTR);Tg(fabp10a:smocs2) 6 dpf larvae. Four larvae were pooled for each replicate. n = 5. A Mann–Whitney test was used to assess significance. *P = 0.0159. Data are presented as mean values ± SEM. (H, I, J) Single-plane confocal images of pancreatic islets of control (H) and sodium molybdate–treated (I) Tg(ins:flag-NTR);Tg(ins:H2BGFP) 6 dpf zebrafish larvae after 2 d of β-cell regeneration, during which EdU incubation occurred. (J) Quantification of the number of ins:H2BGFP+ and ins:H2BGFP+EdU+ cells (J). Scale bar, 10 μm. n = 42–49. A Mann–Whitney test was used to assess significance for β-cell numbers, and an unpaired t test was used to assess significance for ins:H2BGFP+EdU+. ***P = 0.0005 and 0.0008, respectively. Data are presented as mean values ± SEM and are pooled from three independent experiments. (K) Glucose levels of Tg(ins:CFP-NTR) 6 dpf larvae treated with 10 or 25 μM sodium molybdate. Four larvae were pooled for each replicate. n = 6. Data are presented as mean values ± SEM.

Phenotyping of Mocs2+/− mice.

(A, B, C, D, E, F, G, H) Single-plane confocal images of mouse islets from female Mocs2+/+ (A, B) and Mocs2+/− (C, D), as well as male Mocs2+/+ (E, F) and Mocs2+/− (G, H), stained for Gcg and Ucn3, and counterstained with DAPI. Scale bar, 20 μm. (I, J, K) Body weight measurement before the start of the fasting period for the intraperitoneal glucose tolerance test from female (I), male (J), and combined data (K) for Mocs2+/+ and Mocs2+/− mice. A Mann–Whitney test was used to assess significance. (L, M, N) Fasting glucose measurement from female (L), male (M), and combined data (N) for Mocs2+/+ and Mocs2+/− mice. A t test was used to assess significance. (O, P, Q) Intraperitoneal glucose tolerance test results from female (O), male (P), and combined data (Q) for Mocs2+/+ and Mocs2+/− mice. Two-way ANOVA followed by Šidák’s multiple test was used to assess significance.

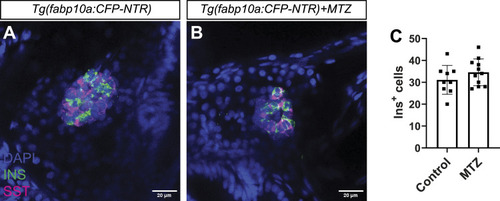
Hepatocyte ablation does not affect β-cell development.

(A, B, C) Single-plane confocal images of pancreatic islets from Tg(fabp10a:CFP-NTR) larvae treated with DMSO (A) or MTZ (B) for 24 h. (C) Quantification of β-cells (INS+ in green) (C) did not show any difference between the conditions. Scale bar, 20 μm. n = 9–11.

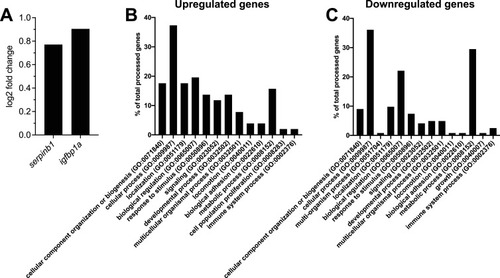
Pathway enrichment analysis of RNA-Seq dataset.

(A) Log2 fold change levels of serpinb1 and igfbp1a in hepatocytes after β-cell ablation. (B, C) Enriched pathways for the up-regulated (B) and down-regulated (C) genes after β-cell ablation in the RNA-Seq dataset.

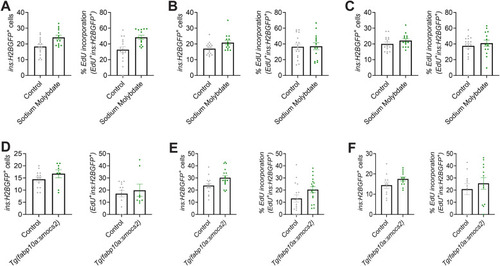
Biological variability of the molybdenum pathway phenotype in β-cell proliferation.

(A, B, C) Three independent biological experiments (zebrafish bred at different days) for control or sodium molybdate–treated Tg(ins:H2BGFP);Tg(ins:flag-NTR) 6 dpf zebrafish larvae that were used for quantification of Fig 3J showing the β-cell number and percentage of β-cell proliferation (calculated as EdU+ins:H2BGFP+/ins:H2BGFP+). Data are presented as mean values ± SEM. (D, E, F) Three independent biological experiments (zebrafish bred at different days) for control or Tg(fabp10a:smocs2) Tg(ins:H2BGFP);Tg(ins:flag-NTR) 6 dpf zebrafish larvae that were used for quantification of Fig 3F showing the β-cell number and percentage of β-cell proliferation (calculated as EdU+ins:H2BGFP+/ins:H2BGFP+). Data are presented as mean values ± SEM.

Sodium molybdate induces the β-cell proliferation marker ins:venus-geminin but does not impact proliferation of other islet cell types.

(A, B, C) Single-plane confocal images of pancreatic islets in 6 dpf Tg(ins:flag-NTR); Tg(ins:venus-geminin) larvae after β-cell ablation and control (A) or sodium molybdate treatment (B) for 48 h. The nuclei are counterstained with TO-PRO-3. (C) Quantification of proliferating, ins:venus-geminin+, β-cells (C). Four independent experiments are shown with each independent experiment color-coded separately. Scale bar, 10 μm. n = 53–61. *P = 0.0231, non-parametric Mann–Whitney test. Data are presented as mean values ± SEM. (D, E, F) Single-plane confocal images of pancreatic islets in Tg(ins:H2BGFP) larvae after control (D) or sodium molybdate treatment (E) for 48 h, in the presence of EdU. (F) Quantification of total number and proliferating, ins:H2BGFP+EdU+, β-cells (F). Representative experiment from three biological replicates. Scale bar, 10 μm. n = 13–15. Data are presented as mean values ± SEM. (G, H, I, J) Single-plane confocal images of pancreatic islets in Tg(ins:flag-NTR) larvae after control (G) or sodium molybdate treatment (J) for 48 h, in the presence of EdU, after β-cell ablation, counterstained with Gcg and Sst. (I, J) Quantification of proliferating Gcg+EdU+ α-cells (I) and Sst+EdU+ δ-cells (J). Representative experiment of two biological replicates. Scale bar, 10 μm. n = 11–12. Data are presented as mean values ± SEM.

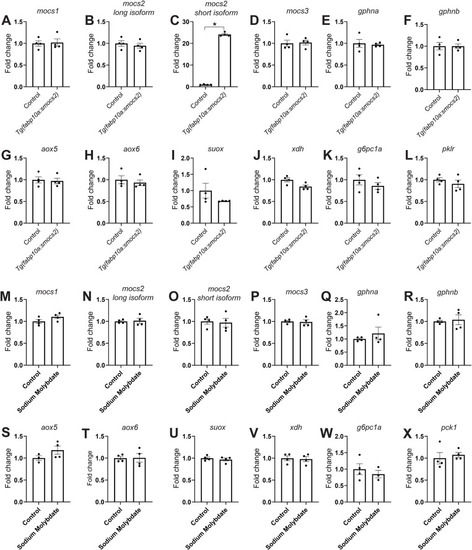
Gene expression profile of the molybdenum biosynthetic pathway in zebrafish.

(A, B, C, D, E, F, G, H, I, J, K, L) Gene expression changes (fold change values) at the end of the regenerative period in Tg(ins:flag-NTR);Tg(fabp10a:smocs2) 6 dpf zebrafish larvae, that is, for genes involved in the molybdenum cofactor biosynthetic pathway (A, B, C, D, E, F), enzymes using Moco (G, H, I, J), and key glycolytic/gluconeogenic enzymes (K, L). (C)n = 4. *P = 0.0286, a non-parametric Mann–Whitney test for (C). Data are presented as mean values ± SEM. (M, N, O, P, Q, R, S, T, U, V, W, X) Gene expression changes (fold change values) after β-cell ablation 3–4 dpf in Tg(ins:flag-NTR) zebrafish larvae and control or sodium molybdate treatment 4–6 dpf, that is, for genes involved in the molybdenum cofactor biosynthetic pathway (M, N, O, P, Q, R), enzymes using Moco (S, T, U, V), and key glycolytic/gluconeogenic enzymes (W, X). n = 4. Data are presented as mean values ± SEM.

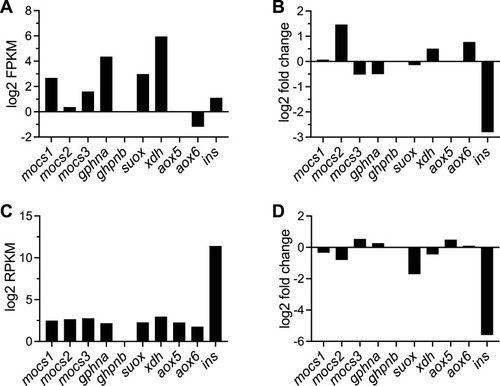
Expression levels of genes of the Moco biosynthetic pathway in hepatocytes and pancreatic islets from zebrafish.

(A, B) Expression levels of the enzymes involved in Moco biosynthesis and use in isolated hepatocytes (A). (B) Fold change of the same enzymes in hepatocytes after β-cell ablation (B). (C, D) Expression levels of the enzymes involved in Moco biosynthesis and use in isolated islets from zebrafish larvae (C). (D) Fold change of the same enzymes in primary islets of zebrafish larvae after β-cell ablation (D).

Expression levels of genes involved in the Moco biosynthetic pathway in mouse pancreas.

(A, B) Dot plots showing the expression levels of the core gene of the Moco biosynthetic pathway across the different cell populations of the mouse pancreas (A) and across different models of diabetes in mice (B).

Expression levels of genes involved in the Moco biosynthetic pathway in human pancreas and liver.

(A, B, C, D, E, F, G) Violin plots showing the expression levels of the core gene of the Moco biosynthetic pathway across the different cell populations of the human pancreas. (H, I, J, K, L, M, N) Violin plots showing the expression levels of the core gene of the Moco biosynthetic pathway across the different cell populations of the human liver.

Hematoxylin and eosin photomicrographs of liver and pancreas, and double immunohistochemistry images of the pancreas of Mocs2+/− mice.

(A, B, C, D, E, F) Images showing no abnormalities or differences in any examined tissue between Mocs2+/+ and Mocs2+/− male mice. (A, B, D, E) Representative H&E brightfield images from liver and pancreas from Mocs2+/+ (A, B) and Mocs2+/− (D, E) male mice. (C, F) Immunohistochemical double staining of the endocrine pancreas to assess islet morphology, showing insulin-producing (Ins, red) and glucagon-producing (Gcg, brown) cells in Mocs2+/+ (C) and Mocs2+/− (F) male mice. The morphology was similar to that of female mice. Scale bars are indicated in the figure. (G) Quantification of the INS-positive area as the percentage of the total pancreas area. Data are presented as mean values ± SEM. n = 4.

Clinical markers of liver functionality of Mocs2+/− mice.

(A, B, C) ALAT activity (A), bilirubin levels (B), and ALP activity (C) in the plasma of female Mocs2+/+ and Mocs2+/− mice. (D, E, F) ALAT activity (D), bilirubin levels (E), and ALP activity (F) in the plasma of male Mocs2+/+ and Mocs2+/−mice. (G, H, I) ALAT activity (G), bilirubin levels (H), and ALP activity (I) in the plasma of combined male and female Mocs2+/+ and Mocs2+/−mice.

Acknowledgments
This image is the copyrighted work of the attributed author or publisher, and ZFIN has permission only to display this image to its users. Additional permissions should be obtained from the applicable author or publisher of the image. Full text @ Life Sci Alliance