|
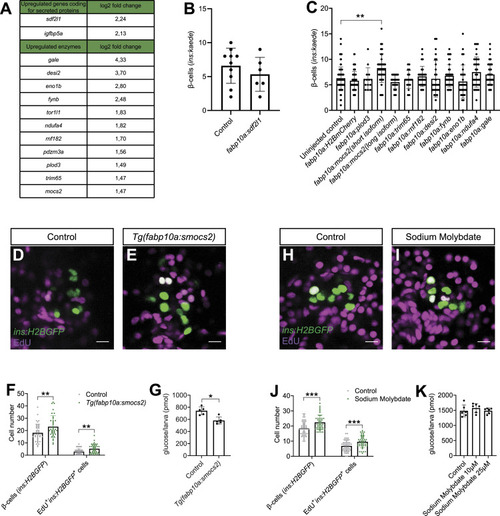
Genetic screen reveals a role for the molybdenum cofactor biosynthetic pathway in β-cell regeneration. (A) Table showing the log2 fold changes of the significantly up-regulated genes encoding for secreted proteins and enzymes in hepatocytes after β-cell ablation. (B) Quantification of regenerated β-cells in 6 dpf Tg(ins:kaede);Tg(ins:CFP-NTR) larvae overexpressing sdf2l1 in hepatocytes. n = 6–10. Data are presented as mean values ± SEM. (A, C) Quantification of β-cells in control and zebrafish larvae injected at the one-cell stage with vectors driving the expression of the enzymes identified in hepatocytes (A) under the control of the fabp10a promoter (together with mRNA encoding the transposase enzyme to induce genomic integration). After injections, β-cells were ablated from 3 to 4 dpf and the β-cells were counted manually after 2 d of regeneration in the Tg(ins:kaede);Tg(ins:CFP-NTR) zebrafish larvae at 6 dpf. n = 14–104. Data for the control experiments were pooled from four independent experiments. If there was a positive hit in the first experiment, the experiments were repeated and data pooled in this graph. A Kruskal–Wallis test followed by Dunn’s multiple comparison test was used to assess statistical significance. **P = 0.0038. Data are presented as mean values ± SEM. (D, E, F) Single-plane confocal images of pancreatic islets of control (D) and Tg(fabp10a:smocs2) (E) Tg(ins:flag-NTR);Tg(ins:H2BGFP) 6 dpf zebrafish larvae after 2 d of β-cell regeneration, during which EdU incubation occurred. (F) Quantification of the number of ins:H2BGFP+ and ins:H2BGFP+EdU+ cells (F). Scale bar, 10 μm. n = 37–40. A Mann–Whitney test was used to assess significance. **P = 0.0079 and 0.0037, respectively. Data are presented as mean values ± SEM and are pooled from three independent experiments. (G) Glucose levels in Tg(ins:flag-NTR);Tg(fabp10a:smocs2) 6 dpf larvae. Four larvae were pooled for each replicate. n = 5. A Mann–Whitney test was used to assess significance. *P = 0.0159. Data are presented as mean values ± SEM. (H, I, J) Single-plane confocal images of pancreatic islets of control (H) and sodium molybdate–treated (I) Tg(ins:flag-NTR);Tg(ins:H2BGFP) 6 dpf zebrafish larvae after 2 d of β-cell regeneration, during which EdU incubation occurred. (J) Quantification of the number of ins:H2BGFP+ and ins:H2BGFP+EdU+ cells (J). Scale bar, 10 μm. n = 42–49. A Mann–Whitney test was used to assess significance for β-cell numbers, and an unpaired t test was used to assess significance for ins:H2BGFP+EdU+. ***P = 0.0005 and 0.0008, respectively. Data are presented as mean values ± SEM and are pooled from three independent experiments. (K) Glucose levels of Tg(ins:CFP-NTR) 6 dpf larvae treated with 10 or 25 μM sodium molybdate. Four larvae were pooled for each replicate. n = 6. Data are presented as mean values ± SEM.
|