IMAGE

Figure S5.

ID
ZDB-IMAGE-240821-45
Source
Figures for Karampelias et al., 2024
Image
Figure Caption

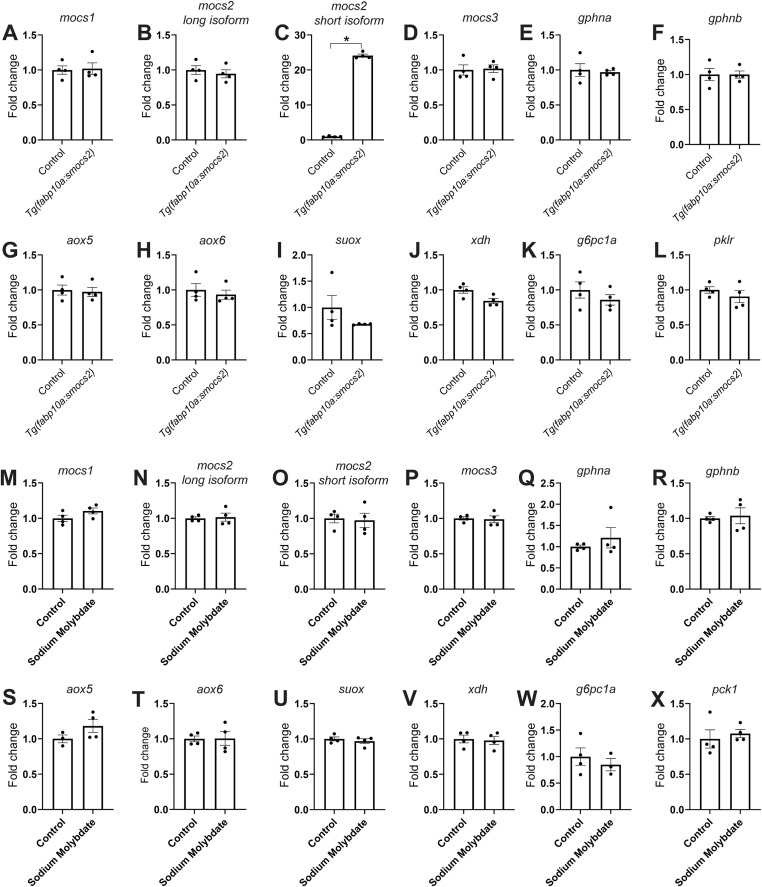
Figure S5. Gene expression profile of the molybdenum biosynthetic pathway in zebrafish.

(A, B, C, D, E, F, G, H, I, J, K, L) Gene expression changes (fold change values) at the end of the regenerative period in Tg(ins:flag-NTR);Tg(fabp10a:smocs2) 6 dpf zebrafish larvae, that is, for genes involved in the molybdenum cofactor biosynthetic pathway (A, B, C, D, E, F), enzymes using Moco (G, H, I, J), and key glycolytic/gluconeogenic enzymes (K, L). (C)n = 4. *P = 0.0286, a non-parametric Mann–Whitney test for (C). Data are presented as mean values ± SEM. (M, N, O, P, Q, R, S, T, U, V, W, X) Gene expression changes (fold change values) after β-cell ablation 3–4 dpf in Tg(ins:flag-NTR) zebrafish larvae and control or sodium molybdate treatment 4–6 dpf, that is, for genes involved in the molybdenum cofactor biosynthetic pathway (M, N, O, P, Q, R), enzymes using Moco (S, T, U, V), and key glycolytic/gluconeogenic enzymes (W, X). n = 4. Data are presented as mean values ± SEM.

Acknowledgments
This image is the copyrighted work of the attributed author or publisher, and ZFIN has permission only to display this image to its users. Additional permissions should be obtained from the applicable author or publisher of the image. Full text @ Life Sci Alliance