IMAGE

Figure S4.

ID
ZDB-IMAGE-240821-44
Source
Figures for Karampelias et al., 2024
Image
Figure Caption

Figure S4. 
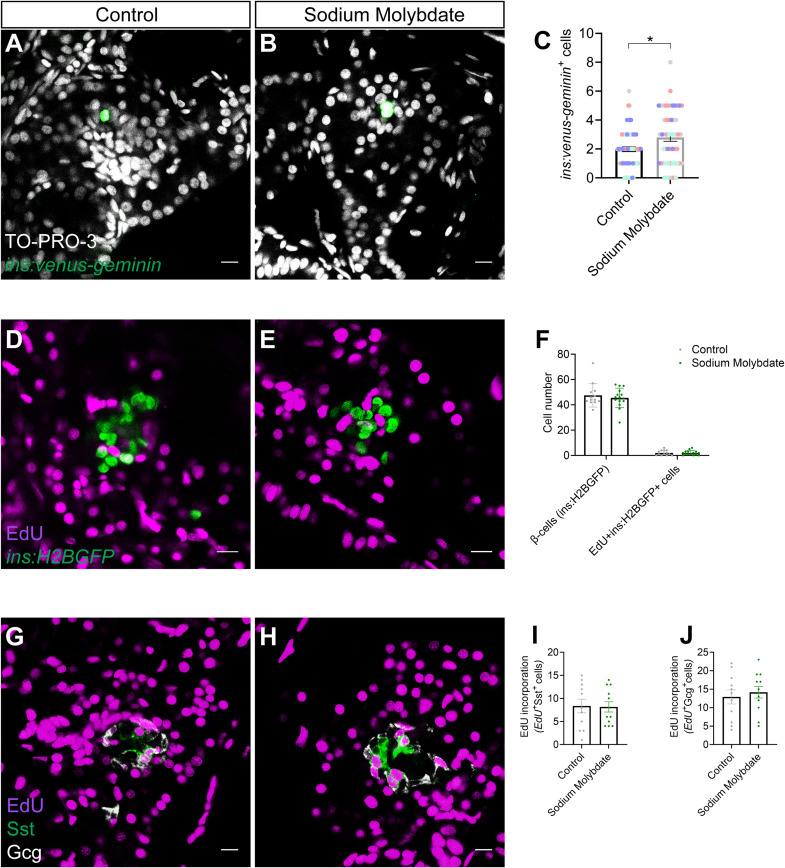
Sodium molybdate induces the β-cell proliferation marker ins:venus-geminin but does not impact proliferation of other islet cell types.

(A, B, C) Single-plane confocal images of pancreatic islets in 6 dpf Tg(ins:flag-NTR); Tg(ins:venus-geminin) larvae after β-cell ablation and control (A) or sodium molybdate treatment (B) for 48 h. The nuclei are counterstained with TO-PRO-3. (C) Quantification of proliferating, ins:venus-geminin+, β-cells (C). Four independent experiments are shown with each independent experiment color-coded separately. Scale bar, 10 μm. n = 53–61. *P = 0.0231, non-parametric Mann–Whitney test. Data are presented as mean values ± SEM. (D, E, F) Single-plane confocal images of pancreatic islets in Tg(ins:H2BGFP) larvae after control (D) or sodium molybdate treatment (E) for 48 h, in the presence of EdU. (F) Quantification of total number and proliferating, ins:H2BGFP+EdU+, β-cells (F). Representative experiment from three biological replicates. Scale bar, 10 μm. n = 13–15. Data are presented as mean values ± SEM. (G, H, I, J) Single-plane confocal images of pancreatic islets in Tg(ins:flag-NTR) larvae after control (G) or sodium molybdate treatment (J) for 48 h, in the presence of EdU, after β-cell ablation, counterstained with Gcg and Sst. (I, J) Quantification of proliferating Gcg+EdU+ α-cells (I) and Sst+EdU+ δ-cells (J). Representative experiment of two biological replicates. Scale bar, 10 μm. n = 11–12. Data are presented as mean values ± SEM.

Acknowledgments
This image is the copyrighted work of the attributed author or publisher, and ZFIN has permission only to display this image to its users. Additional permissions should be obtained from the applicable author or publisher of the image. Full text @ Life Sci Alliance