IMAGE

Figure S6.

ID
ZDB-IMAGE-240821-46
Source
Figures for Karampelias et al., 2024
Image
Figure Caption

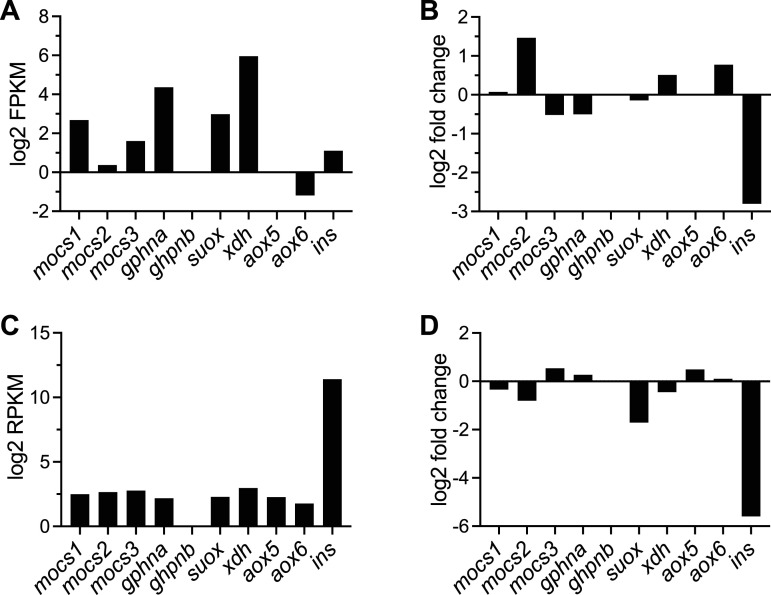
Figure S6. Expression levels of genes of the Moco biosynthetic pathway in hepatocytes and pancreatic islets from zebrafish.

(A, B) Expression levels of the enzymes involved in Moco biosynthesis and use in isolated hepatocytes (A). (B) Fold change of the same enzymes in hepatocytes after β-cell ablation (B). (C, D) Expression levels of the enzymes involved in Moco biosynthesis and use in isolated islets from zebrafish larvae (C). (D) Fold change of the same enzymes in primary islets of zebrafish larvae after β-cell ablation (D).

Acknowledgments
This image is the copyrighted work of the attributed author or publisher, and ZFIN has permission only to display this image to its users. Additional permissions should be obtained from the applicable author or publisher of the image. Full text @ Life Sci Alliance