FIGURE

Figure S3.

ID
ZDB-FIG-240821-42
Publication
Karampelias et al., 2024 - Examining the liver-pancreas crosstalk reveals a role for the molybdenum cofactor in β-cell regeneration
Other Figures
All Figure Page
Back to All Figure Page
Figure S3.

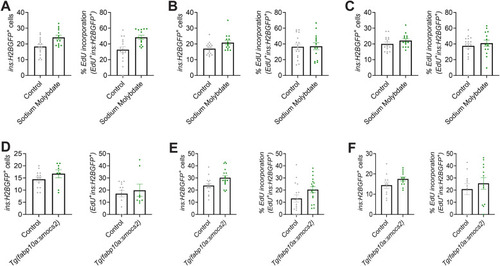
Biological variability of the molybdenum pathway phenotype in β-cell proliferation.

(A, B, C) Three independent biological experiments (zebrafish bred at different days) for control or sodium molybdate–treated Tg(ins:H2BGFP);Tg(ins:flag-NTR) 6 dpf zebrafish larvae that were used for quantification of Fig 3J showing the β-cell number and percentage of β-cell proliferation (calculated as EdU+ins:H2BGFP+/ins:H2BGFP+). Data are presented as mean values ± SEM. (D, E, F) Three independent biological experiments (zebrafish bred at different days) for control or Tg(fabp10a:smocs2) Tg(ins:H2BGFP);Tg(ins:flag-NTR) 6 dpf zebrafish larvae that were used for quantification of Fig 3F showing the β-cell number and percentage of β-cell proliferation (calculated as EdU+ins:H2BGFP+/ins:H2BGFP+). Data are presented as mean values ± SEM.

Expression Data

Expression Detail
Antibody Labeling
Phenotype Data

Phenotype Detail
Acknowledgments
This image is the copyrighted work of the attributed author or publisher, and ZFIN has permission only to display this image to its users. Additional permissions should be obtained from the applicable author or publisher of the image. Full text @ Life Sci Alliance