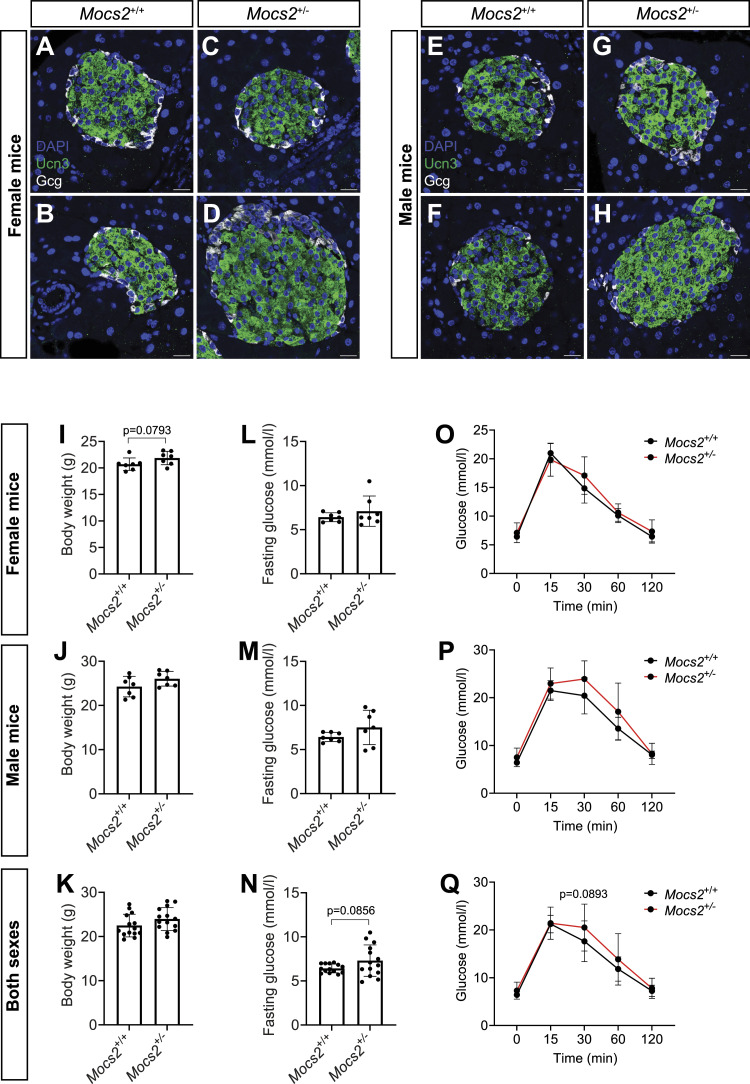
IMAGE

Figure 4.

ID
ZDB-IMAGE-240821-36
Source
Figures for Karampelias et al., 2024
Image
Figure Caption

Figure 4. Phenotyping of Mocs2+/− mice.

(A, B, C, D, E, F, G, H) Single-plane confocal images of mouse islets from female Mocs2+/+ (A, B) and Mocs2+/− (C, D), as well as male Mocs2+/+ (E, F) and Mocs2+/− (G, H), stained for Gcg and Ucn3, and counterstained with DAPI. Scale bar, 20 μm. (I, J, K) Body weight measurement before the start of the fasting period for the intraperitoneal glucose tolerance test from female (I), male (J), and combined data (K) for Mocs2+/+ and Mocs2+/− mice. A Mann–Whitney test was used to assess significance. (L, M, N) Fasting glucose measurement from female (L), male (M), and combined data (N) for Mocs2+/+ and Mocs2+/− mice. A t test was used to assess significance. (O, P, Q) Intraperitoneal glucose tolerance test results from female (O), male (P), and combined data (Q) for Mocs2+/+ and Mocs2+/− mice. Two-way ANOVA followed by Šidák’s multiple test was used to assess significance.

Acknowledgments
This image is the copyrighted work of the attributed author or publisher, and ZFIN has permission only to display this image to its users. Additional permissions should be obtained from the applicable author or publisher of the image. Full text @ Life Sci Alliance