IMAGE

Figure 1.

ID
ZDB-IMAGE-240821-38
Source
Figures for Karampelias et al., 2024
Image
Figure Caption

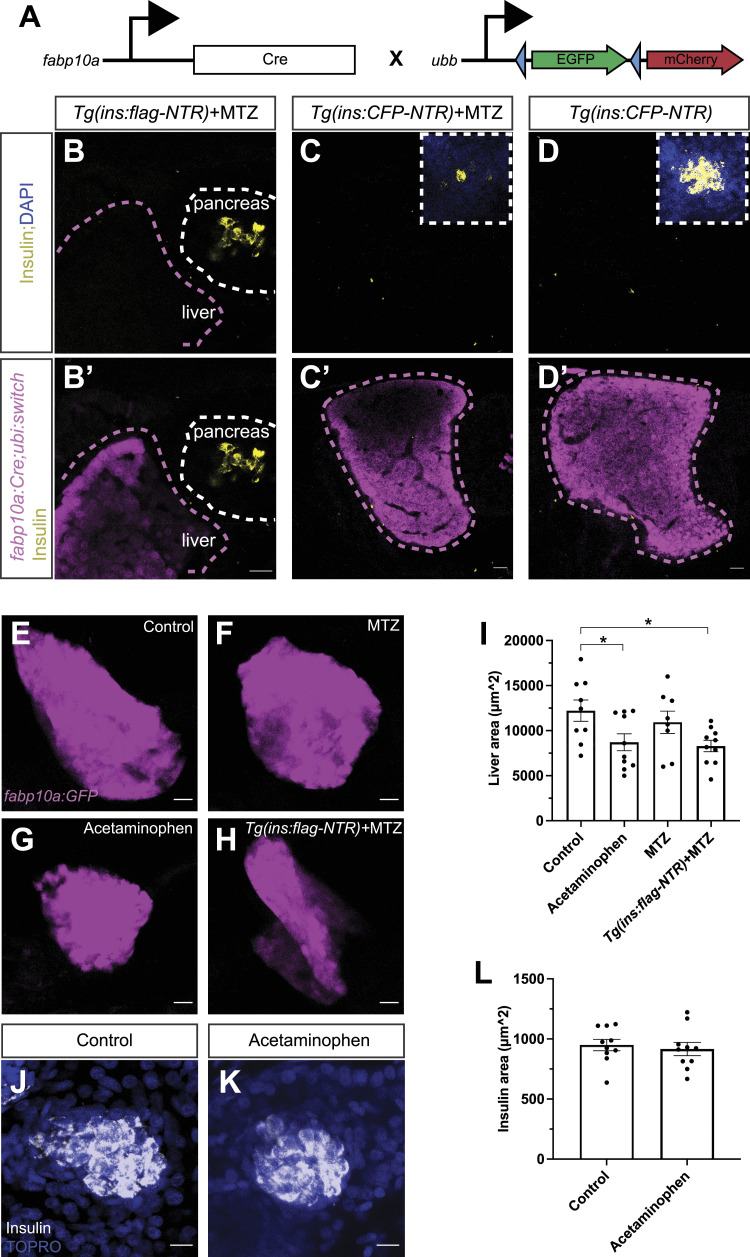
Figure 1. Hepatocytes’ contribution to the spontaneous β-cell regeneration in zebrafish.

(A) Schema showing the lineage-tracing approach to characterize the hepatocyte-to-β-cell reprogramming using the Tg(fabp10a:Cre);Tg(ubi:Switch) zebrafish. Blue arrowheads indicate the loxP sites. (B, B′) Single-plane confocal images of the Tg(fabp10a:Cre);Tg(ins:flag-NTR);Tg(ubi:switch) pancreas (B) and liver (B′) of 6 dpf zebrafish larvae after 2 d of β-cell regeneration immunostained against insulin. The white dashed line outlines the pancreas, and the magenta dashed line outlines the border of the liver. Scale bar, 20 μm. n ≥ 10 larvae examined from two independent experiments. (C, C′, D, D′) Single-plane confocal images of liver and primary islets of Tg(fabp10a:Cre);Tg(ins:CFP-NTR);Tg(ubi:switch) 6 dpf larvae, with (C, C′) or without (D, D′) MTZ treatment, that is, β-cell ablation. Larvae in (C, C′) were left to regenerate their β-cells for 2 d. (C, C′, D, D′) White dashed line outlines the insets of the primary islet of the pancreas (C, D), and the magenta dashed line outlines the border of the liver (C′, D′). Scale bar, 20 μm. n ≥ 10 larvae examined from two independent replicates. (E, F, G, H, I) Maximum projections of livers from control (E), MTZ-treated (F), acetaminophen-treated (G), and Tg(ins:flag-NTR)+MTZ-treated (H) Tg(fabp10a:GFP) 4 dpf zebrafish larvae. Chemical treatments were carried out at 3–4 dpf. (I) Quantification showed a significant decrease in the hepatocyte area after hepatocyte damage or β-cell ablation (I). Scale bar, 20 μm. n = 8–10. Data are presented as the mean values ± SEM. One-way ANOVA was used to estimate statistical significance followed by a Holm–Šidák multiple comparison test. *P = 0.0325 (control versus acetaminophen); *P = 0.0237 (control versus Tg(ins:flag-NTR)+MTZ). (J, K, L) Representative maximum projections of pancreatic islets in control (J) and acetaminophen-treated (3–4 dpf) (K) 5 dpf zebrafish larvae immunostained against insulin. Nuclei were counterstained with TO-PRO-3. (L) Quantification of the insulin area (L). Scale bar, 10 μm. n = 10.

Acknowledgments
This image is the copyrighted work of the attributed author or publisher, and ZFIN has permission only to display this image to its users. Additional permissions should be obtained from the applicable author or publisher of the image. Full text @ Life Sci Alliance