IMAGE

Figure 2.

ID
ZDB-IMAGE-240821-40
Source
Figures for Karampelias et al., 2024
Image
Figure Caption

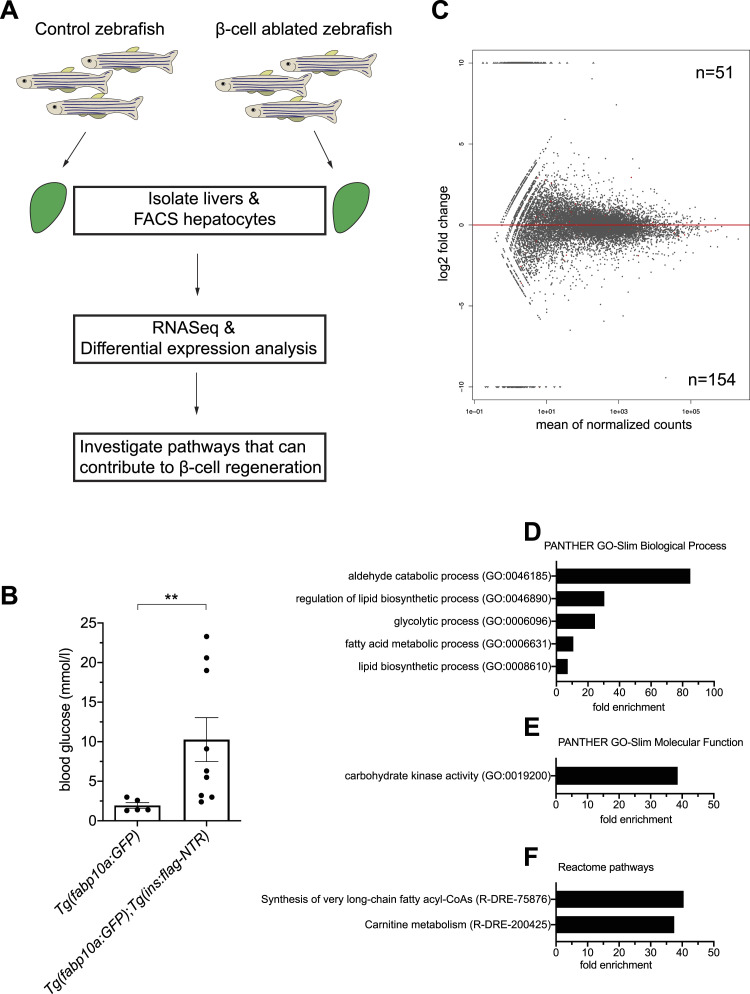
Figure 2. Transcriptomic changes in hepatocytes after β-cell ablation.

(A) Schema showing the experimental design to identify transcriptional changes in hepatocytes after β-cell ablation in 2-mo-old zebrafish. (B) Glucose measurements of the 2-mo-old zebrafish used for hepatocyte isolation. Measurements were made before liver dissection. n = 5–9. A Mann–Whitney test was used to assess significance. **P = 0.0045. (C) Log2 fold change plot showing the up-regulated and down-regulated genes in hepatocytes after β-cell ablation. The significantly differentially expressed genes (P adj < 0.05) are highlighted as red dots. (C, D, E, F) Statistical overrepresentation analysis of the down-regulated genes from (C) using the PantherDB tool. (D, E, F) Fold enrichment of the significantly enriched processes (D), molecular function (E), and Reactome pathways (F) is shown.

Acknowledgments
This image is the copyrighted work of the attributed author or publisher, and ZFIN has permission only to display this image to its users. Additional permissions should be obtained from the applicable author or publisher of the image. Full text @ Life Sci Alliance