
- Title
-
Tissue-resident trained immunity in hepatocytes protects against septic liver injury in zebrafish
- Authors
- Wang, Z., Liu, Y., Hu, J., You, X., Yang, J., Zhang, Y., Liu, Q., Yang, D.
- Source
- Full text @ Cell Rep.
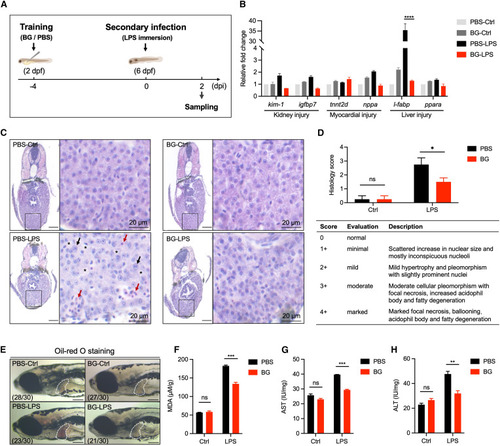
β-Glucan training protects zebrafish larvae from LPS-induced septic liver injury (A) Schematic of β-glucan training and LPS challenge in zebrafish larvae. (B) Transcriptional expression of marker genes involved in organ injury (including kidney injury, myocardial injury, and liver injury) in PBS- and β-glucan-trained larvae (n = 15) after LPS challenge. (C) Histopathological analysis of zebrafish liver in PBS- and β-glucan-trained larvae after LPS challenge. Boxed areas are magnified on the right. Scale bars, 50 μm for the original images and 20 μm for the magnified images. Black arrows indicate hypertrophy and pleomorphism, red arrows indicate focal necrosis and increased acidophil body, and asterisks indicate fatty degeneration and ballooning. (D) Scoring for the histopathology shown in (C). The criteria for scoring are listed in the table below. (E) Lateral image analysis of PBS- and β-glucan-trained larvae after LPS challenge using oil red O staining. The livers of zebrafish larvae are indicated with white dashes. Scale bar, 150 μm. The ratio of phenotypes is indicated in the images. (F‒H) Analysis of liver injury-associated biochemical indicators, including MDA (F), AST (G), and ALT (H), in PBS- and β-glucan-trained larvae after LPS challenge. Data are replicated with three independent experiments and shown as mean ± SD by two-way ANOVA with multiple comparisons. ∗p < 0.05, ∗∗p < 0.01, ∗∗∗p < 0.001, ∗∗∗∗p < 0.0001; ns, not significant. See also Figure S1. |
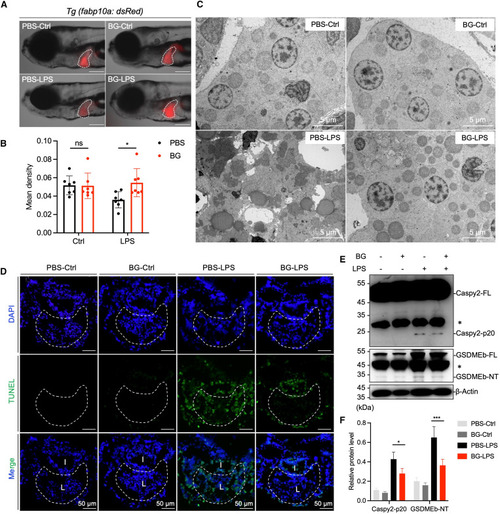
β-Glucan training alleviates LPS-induced pyroptosis in zebrafish liver cells (A) Lateral fluorescence images of PBS- and β-glucan-trained Tg (fabp10a: dsRed) larvae after LPS challenge. The livers of zebrafish larvae are indicated with white dashes. Scale bar, 150 μm. (B) Statistical quantification of liver fluorescence (n = 10) as indicated in (A). (C) TEM analysis of the ultrastructure of liver cells in PBS- and β-glucan-trained larvae after LPS challenge. Scale bar, 5 μm. (D) Images of immunofluorescence in PBS- and β-glucan-trained larvae after LPS challenge using TUNEL staining, TUNEL (green), and DAPI (blue). The inside liver area is circled with a white dotted line and labeled with “L,” and the intestine area is labeled with “I.” Scale bar, 100 μm. (E) Western blot analysis of Caspy2/GSDMEb in PBS- and β-glucan-trained larvae after LPS challenge. FL, full-length, NT, N-terminal, ∗, non-specific bands. (F) Quantification of relative protein level in (E) through grayscale analysis. Data are replicated with three independent experiments and shown as mean ± SD by a two-way ANOVA with multiple comparisons. ∗p < 0.05, ∗∗∗p < 0.001. See also Figure S2. |
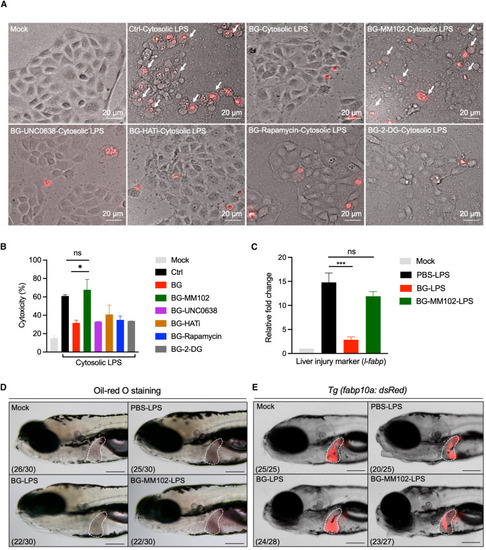
β-Glucan training engages H3K4me3 modification to relieve septic liver injury (A) Images of pyroptotic phenotypes in mock- and β-glucan-trained zebrafish liver cells with or without indicated inhibitor treatment after cytosolic LPS challenge. Red, PI staining. White arrows indicate pyroptotic cells with membrane swelling and rupture. Scale bar, 20 μm. (B) Cytotoxicity analysis of the indicated inhibitor-treated zebrafish liver cells after cytosolic LPS challenge as in (A). (C) Transcriptional expression of the liver injury marker gene l-fabp in PBS- and β-glucan-trained larvae with/without MM102 treatment after LPS challenge. (D) Lateral images of oil red O staining in PBS- and β-glucan-trained larvae with or without MM102 treatment after LPS challenge. The livers of zebrafish larvae are indicated with white dashes. Scale bar, 150 μm. The ratio of phenotypes is indicated under the images. (E) Lateral fluorescent images of PBS- and β-glucan-trained Tg (fabp10a: dsRed) larvae with or without MM102 treatment after LPS challenge. The livers of zebrafish larvae are indicated with white dashes. Scale bar, 150 μm. The ratio of phenotypes is indicated under the images. Data are replicated with three independent experiments and shown as mean ± SD by unpaired Student’s t test. ∗p < 0.05, ∗∗∗p < 0.001. See also Figures S3 and S4. EXPRESSION / LABELING:
PHENOTYPE:
|
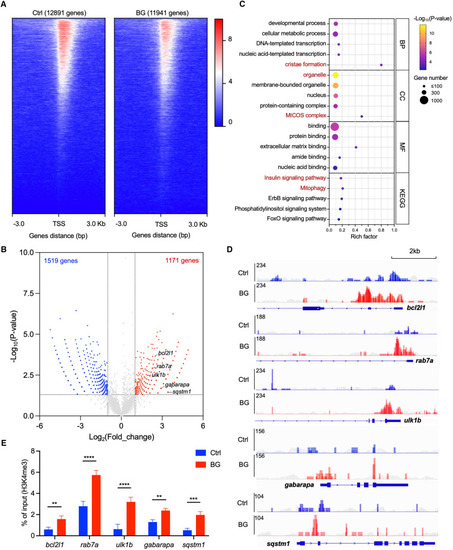
β-Glucan training engages H3K4me3 modification of mitophagy-associated genes in zebrafish liver cells (A) Heatmap of reads distributions (from Bigwig) across genes in control (Ctrl) and β-glucan-trained (BG) zebrafish liver cells after H3K4me3 ChIP-seq. TSS, transcriptional start site. (B) Volcano plot of differential peak-associated genes analysis in β-glucan-trained cells compared to the Ctrl group. Red dots represent H3K4me3 highly enriched genes (Log2(fold_change) > 1 and p < 0.05), and blue dots represent H3K4me3 less enriched genes (Log2(fold_change) < −1 and p < 0.05). The top 5 H3K4me3 highly enriched genes identified in the mitophagy pathway are marked in the plot. (C) Bubble plot of GO terms (including BP, CC, and MF) and Kyoto Encyclopedia of Genes and Genomes (KEGG) pathway analysis with enriched genes in β-glucan-trained cells compared to the Ctrl group. BP, biological process; CC, cell component; MF, molecular function. The terms associated with mitochondria are highlighted in red. (D) Visualized peaks of H3K4me3-bound loci in the indicated mitophagy-related genes that are marked in (B). Scale bar, 2 kb. The peaks of the corresponding input groups are shown in gray as background. (E) qPCR analysis of ChIP (ChIP-qPCR) performed against H3K4me3 in Ctrl and β-glucan-trained (BG) zebrafish liver cells. The data are displayed as enrichment relative to the corresponding input. Data are shown as mean ± SD by two-way ANOVA with multiple comparisons. ∗∗p < 0.01, ∗∗∗p < 0.001, ∗∗∗∗p < 0.0001. |
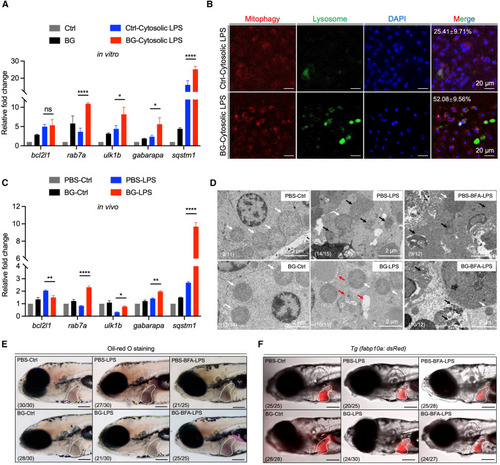
β-Glucan training elevates mitophagy activation to alleviate septic-liver injury (A) Transcriptional expression of mitophagy-related genes in Ctrl- and β-glucan-trained zebrafish liver cells after cytosolic LPS challenge in vitro. (B) Images of mitophagy staining in Ctrl- and β-glucan-trained zebrafish liver cells after cytosolic LPS challenge in vitro. Mitophagy (red), lysosome (green), and DAPI (blue). Scale bar, 20 μm. The ratio of cells with mitophagy is indicated in merged images. (C) Transcriptional expression of mitophagy-related genes in PBS- and β-glucan-trained larvae after LPS challenge in vivo. (D) TEM analysis of the ultrastructure of mitochondria in hepatocytes of PBS- and β-glucan-trained larvae with/without brefeldin A (BFA) treatment after LPS challenge in vivo. Scale bar, 2 μm. Shown are normal mitochondria (white arrows), injured mitochondria (black arrows), and mitophagy (red arrows). The ratio of phenotypes is indicated in the images. (E) Lateral images (oil red O staining) of PBS- and β-glucan-trained larvae with/without BFA treatment after LPS challenge in vivo. The livers of zebrafish larvae are indicated with white dashes. Scale bar, 150 μm. The ratio of phenotypes is indicated in the images. (F) Lateral fluorescent images of PBS- and β-glucan-trained Tg (fabp10a: dsRed) larvae with/without BFA treatment after LPS challenge in vivo. The livers of zebrafish larvae are indicated with white dashes. Scale bar, 150 μm. The ratio of phenotypes is indicated in the images. Data are replicated with three independent experiments and shown as mean ± SD by two-way ANOVA with multiple comparisons. ∗p < 0.05. ∗∗p < 0.01, ∗∗∗∗p < 0.0001. See also Figure S5. PHENOTYPE:
|
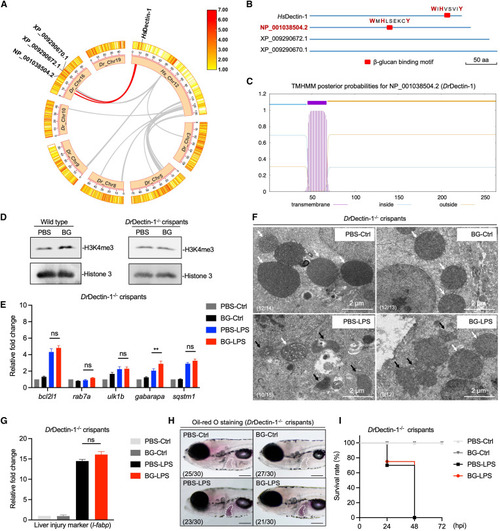
. β-Glucan training protects zebrafish larvae from septic-liver injury through DrDectin-1 (A) Genomic collinearity analysis of Hs_Chr12 with Dr_Chr3/5/8/9/10/16/19. The collinear gene clusters adjacent to dectin-1 are labeled with red lines between Hs_Chr12 and Dr_Chr16. (B) β-Glucan binding motif analysis in three candidate homologous proteins. The critical amino acids (aa) are labeled in red. Scale bar, 50 aa. (C) Transmembrane domain analysis of DrDectin-1. (D) Western blot analysis of H3K4me3 modifications in PBS- and β-glucan-trained wild-type and DrDectin-1−/− crispant larvae. (E) Transcriptional expression of mitophagy-related genes in PBS- and β-glucan-trained DrDectin-1−/− crispant larvae after LPS challenge. (F) TEM analysis of the ultrastructure of mitochondria in hepatocytes in PBS- and β-glucan-trained DrDectin-1−/− crispant larvae after LPS challenge. Scale bar, 2 μm. Shown are normal mitochondria (white arrows) and injured mitochondria (black arrows). The ratio of phenotypes is indicated in the images. (G) Transcriptional expression of the liver injury marker gene, l-fabp, in PBS- and β-glucan-trained DrDectin-1−/− crispant larvae after LPS challenge. (H) Lateral images (oil red O staining) of PBS- and β-glucan-trained DrDectin-1−/− crispant larvae after LPS challenge. The livers of zebrafish larvae are indicated with white dashes. Scale bar, 150 μm. The ratio of phenotypes is indicated in the images. (I) Survival rate analysis of PBS- and β-glucan-trained DrDectin-1−/− crispant larvae after LPS challenge. Data are replicated with three independent experiments and shown as mean ± SD by two-way ANOVA with multiple comparisons or unpaired Student’s t test. ∗∗p < 0.01. See also Figure S6. |

ZFIN is incorporating published figure images and captions as part of an ongoing project. Figures from some publications have not yet been curated, or are not available for display because of copyright restrictions. |