
|
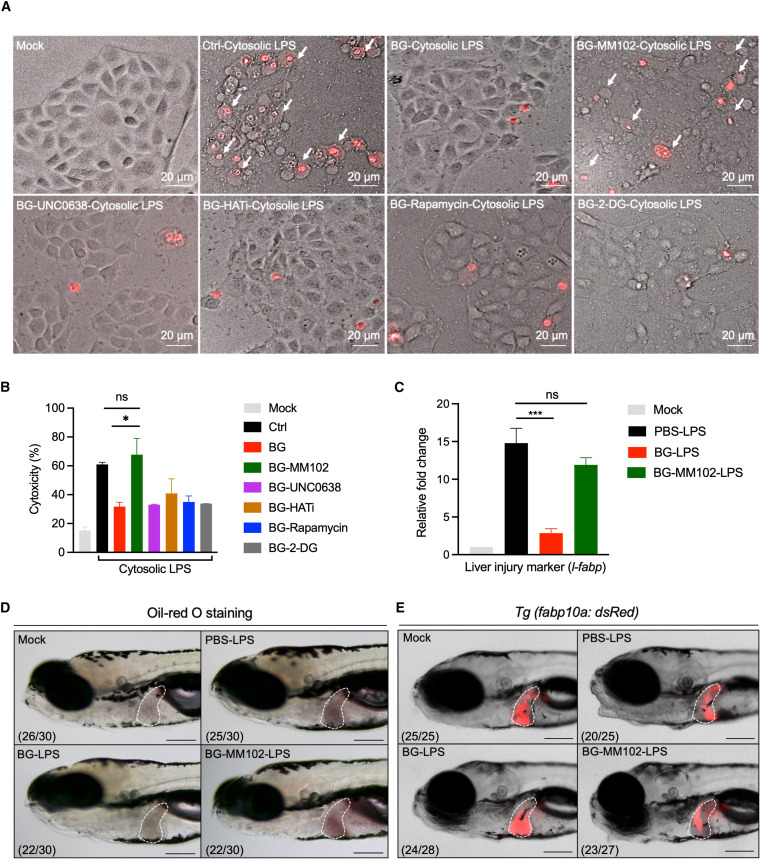
Fig. 3 β-Glucan training engages H3K4me3 modification to relieve septic liver injury (A) Images of pyroptotic phenotypes in mock- and β-glucan-trained zebrafish liver cells with or without indicated inhibitor treatment after cytosolic LPS challenge. Red, PI staining. White arrows indicate pyroptotic cells with membrane swelling and rupture. Scale bar, 20 μm. (B) Cytotoxicity analysis of the indicated inhibitor-treated zebrafish liver cells after cytosolic LPS challenge as in (A). (C) Transcriptional expression of the liver injury marker gene l-fabp in PBS- and β-glucan-trained larvae with/without MM102 treatment after LPS challenge. (D) Lateral images of oil red O staining in PBS- and β-glucan-trained larvae with or without MM102 treatment after LPS challenge. The livers of zebrafish larvae are indicated with white dashes. Scale bar, 150 μm. The ratio of phenotypes is indicated under the images. (E) Lateral fluorescent images of PBS- and β-glucan-trained Tg (fabp10a: dsRed) larvae with or without MM102 treatment after LPS challenge. The livers of zebrafish larvae are indicated with white dashes. Scale bar, 150 μm. The ratio of phenotypes is indicated under the images. Data are replicated with three independent experiments and shown as mean ± SD by unpaired Student’s t test. ∗p < 0.05, ∗∗∗p < 0.001. See also Figures S3 and S4.