
Fig. 4
|
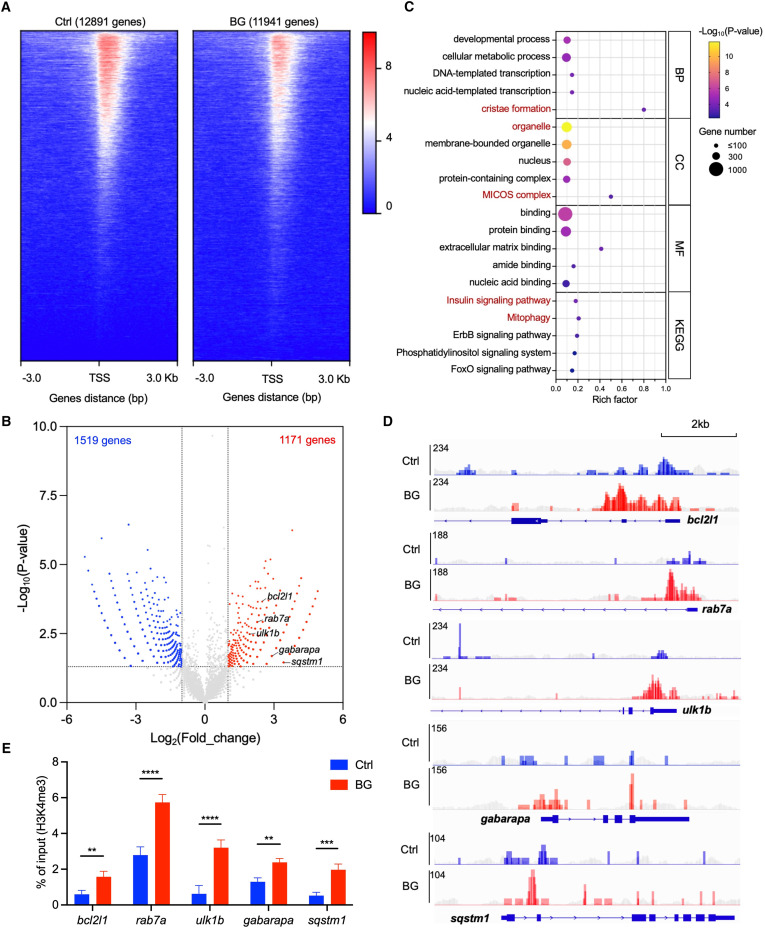
Fig. 4 β-Glucan training engages H3K4me3 modification of mitophagy-associated genes in zebrafish liver cells (A) Heatmap of reads distributions (from Bigwig) across genes in control (Ctrl) and β-glucan-trained (BG) zebrafish liver cells after H3K4me3 ChIP-seq. TSS, transcriptional start site. (B) Volcano plot of differential peak-associated genes analysis in β-glucan-trained cells compared to the Ctrl group. Red dots represent H3K4me3 highly enriched genes (Log2(fold_change) > 1 and p < 0.05), and blue dots represent H3K4me3 less enriched genes (Log2(fold_change) < −1 and p < 0.05). The top 5 H3K4me3 highly enriched genes identified in the mitophagy pathway are marked in the plot. (C) Bubble plot of GO terms (including BP, CC, and MF) and Kyoto Encyclopedia of Genes and Genomes (KEGG) pathway analysis with enriched genes in β-glucan-trained cells compared to the Ctrl group. BP, biological process; CC, cell component; MF, molecular function. The terms associated with mitochondria are highlighted in red. (D) Visualized peaks of H3K4me3-bound loci in the indicated mitophagy-related genes that are marked in (B). Scale bar, 2 kb. The peaks of the corresponding input groups are shown in gray as background. (E) qPCR analysis of ChIP (ChIP-qPCR) performed against H3K4me3 in Ctrl and β-glucan-trained (BG) zebrafish liver cells. The data are displayed as enrichment relative to the corresponding input. Data are shown as mean ± SD by two-way ANOVA with multiple comparisons. ∗∗p < 0.01, ∗∗∗p < 0.001, ∗∗∗∗p < 0.0001.