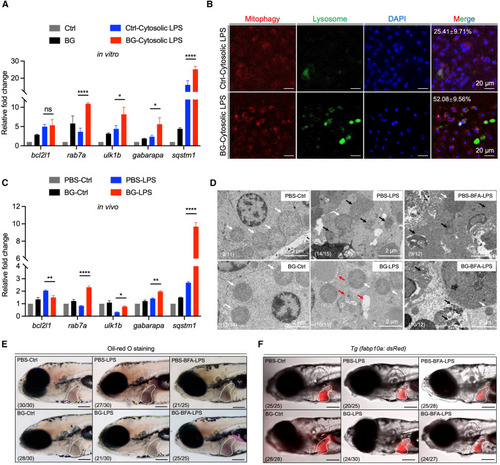
β-Glucan training elevates mitophagy activation to alleviate septic-liver injury (A) Transcriptional expression of mitophagy-related genes in Ctrl- and β-glucan-trained zebrafish liver cells after cytosolic LPS challenge in vitro. (B) Images of mitophagy staining in Ctrl- and β-glucan-trained zebrafish liver cells after cytosolic LPS challenge in vitro. Mitophagy (red), lysosome (green), and DAPI (blue). Scale bar, 20 μm. The ratio of cells with mitophagy is indicated in merged images. (C) Transcriptional expression of mitophagy-related genes in PBS- and β-glucan-trained larvae after LPS challenge in vivo. (D) TEM analysis of the ultrastructure of mitochondria in hepatocytes of PBS- and β-glucan-trained larvae with/without brefeldin A (BFA) treatment after LPS challenge in vivo. Scale bar, 2 μm. Shown are normal mitochondria (white arrows), injured mitochondria (black arrows), and mitophagy (red arrows). The ratio of phenotypes is indicated in the images. (E) Lateral images (oil red O staining) of PBS- and β-glucan-trained larvae with/without BFA treatment after LPS challenge in vivo. The livers of zebrafish larvae are indicated with white dashes. Scale bar, 150 μm. The ratio of phenotypes is indicated in the images. (F) Lateral fluorescent images of PBS- and β-glucan-trained Tg (fabp10a: dsRed) larvae with/without BFA treatment after LPS challenge in vivo. The livers of zebrafish larvae are indicated with white dashes. Scale bar, 150 μm. The ratio of phenotypes is indicated in the images. Data are replicated with three independent experiments and shown as mean ± SD by two-way ANOVA with multiple comparisons. ∗p < 0.05. ∗∗p < 0.01, ∗∗∗∗p < 0.0001. See also Figure S5.
|
