
|
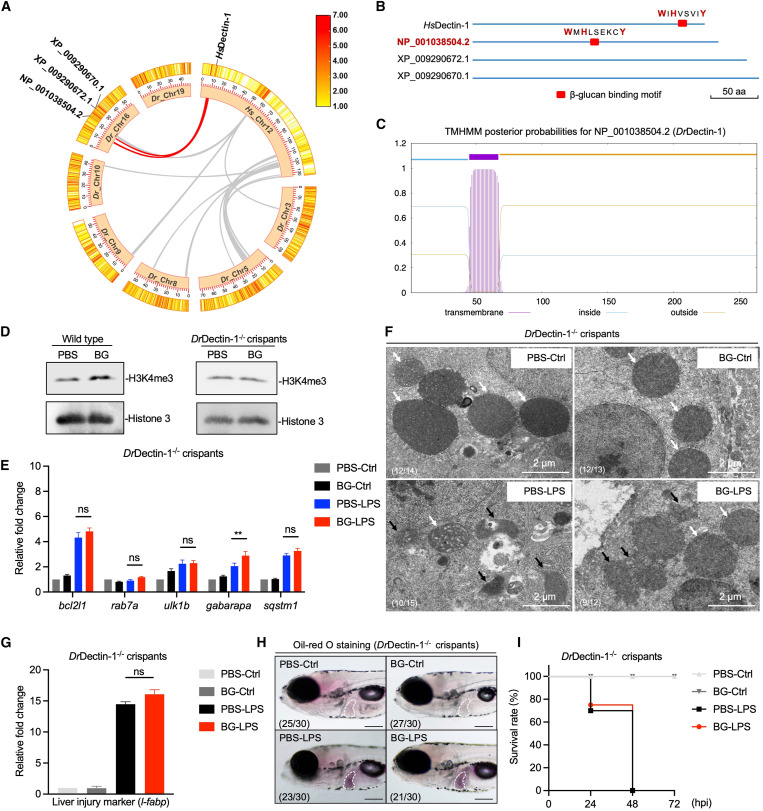
Fig. 6 . β-Glucan training protects zebrafish larvae from septic-liver injury through DrDectin-1 (A) Genomic collinearity analysis of Hs_Chr12 with Dr_Chr3/5/8/9/10/16/19. The collinear gene clusters adjacent to dectin-1 are labeled with red lines between Hs_Chr12 and Dr_Chr16. (B) β-Glucan binding motif analysis in three candidate homologous proteins. The critical amino acids (aa) are labeled in red. Scale bar, 50 aa. (C) Transmembrane domain analysis of DrDectin-1. (D) Western blot analysis of H3K4me3 modifications in PBS- and β-glucan-trained wild-type and DrDectin-1−/− crispant larvae. (E) Transcriptional expression of mitophagy-related genes in PBS- and β-glucan-trained DrDectin-1−/− crispant larvae after LPS challenge. (F) TEM analysis of the ultrastructure of mitochondria in hepatocytes in PBS- and β-glucan-trained DrDectin-1−/− crispant larvae after LPS challenge. Scale bar, 2 μm. Shown are normal mitochondria (white arrows) and injured mitochondria (black arrows). The ratio of phenotypes is indicated in the images. (G) Transcriptional expression of the liver injury marker gene, l-fabp, in PBS- and β-glucan-trained DrDectin-1−/− crispant larvae after LPS challenge. (H) Lateral images (oil red O staining) of PBS- and β-glucan-trained DrDectin-1−/− crispant larvae after LPS challenge. The livers of zebrafish larvae are indicated with white dashes. Scale bar, 150 μm. The ratio of phenotypes is indicated in the images. (I) Survival rate analysis of PBS- and β-glucan-trained DrDectin-1−/− crispant larvae after LPS challenge. Data are replicated with three independent experiments and shown as mean ± SD by two-way ANOVA with multiple comparisons or unpaired Student’s t test. ∗∗p < 0.01. See also Figure S6.