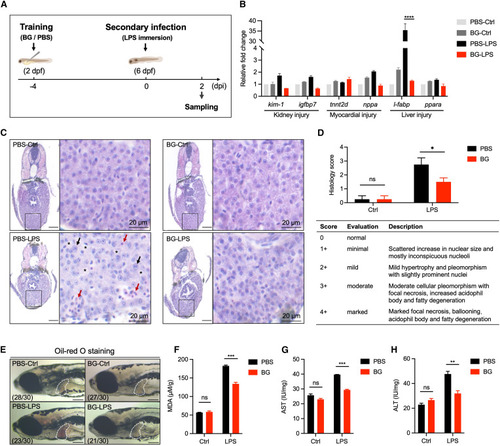
β-Glucan training protects zebrafish larvae from LPS-induced septic liver injury (A) Schematic of β-glucan training and LPS challenge in zebrafish larvae. (B) Transcriptional expression of marker genes involved in organ injury (including kidney injury, myocardial injury, and liver injury) in PBS- and β-glucan-trained larvae (n = 15) after LPS challenge. (C) Histopathological analysis of zebrafish liver in PBS- and β-glucan-trained larvae after LPS challenge. Boxed areas are magnified on the right. Scale bars, 50 μm for the original images and 20 μm for the magnified images. Black arrows indicate hypertrophy and pleomorphism, red arrows indicate focal necrosis and increased acidophil body, and asterisks indicate fatty degeneration and ballooning. (D) Scoring for the histopathology shown in (C). The criteria for scoring are listed in the table below. (E) Lateral image analysis of PBS- and β-glucan-trained larvae after LPS challenge using oil red O staining. The livers of zebrafish larvae are indicated with white dashes. Scale bar, 150 μm. The ratio of phenotypes is indicated in the images. (F‒H) Analysis of liver injury-associated biochemical indicators, including MDA (F), AST (G), and ALT (H), in PBS- and β-glucan-trained larvae after LPS challenge. Data are replicated with three independent experiments and shown as mean ± SD by two-way ANOVA with multiple comparisons. ∗p < 0.05, ∗∗p < 0.01, ∗∗∗p < 0.001, ∗∗∗∗p < 0.0001; ns, not significant. See also Figure S1.
|
