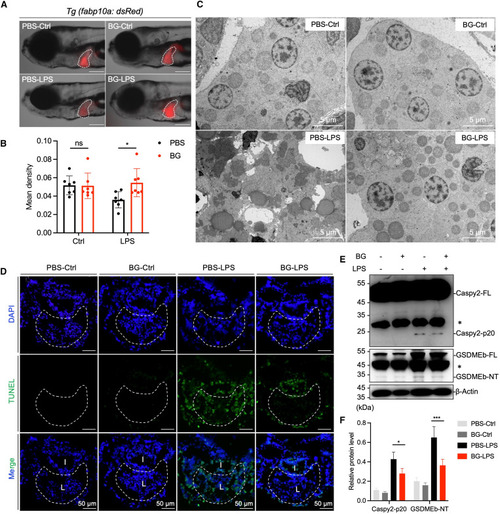
β-Glucan training alleviates LPS-induced pyroptosis in zebrafish liver cells (A) Lateral fluorescence images of PBS- and β-glucan-trained Tg (fabp10a: dsRed) larvae after LPS challenge. The livers of zebrafish larvae are indicated with white dashes. Scale bar, 150 μm. (B) Statistical quantification of liver fluorescence (n = 10) as indicated in (A). (C) TEM analysis of the ultrastructure of liver cells in PBS- and β-glucan-trained larvae after LPS challenge. Scale bar, 5 μm. (D) Images of immunofluorescence in PBS- and β-glucan-trained larvae after LPS challenge using TUNEL staining, TUNEL (green), and DAPI (blue). The inside liver area is circled with a white dotted line and labeled with “L,” and the intestine area is labeled with “I.” Scale bar, 100 μm. (E) Western blot analysis of Caspy2/GSDMEb in PBS- and β-glucan-trained larvae after LPS challenge. FL, full-length, NT, N-terminal, ∗, non-specific bands. (F) Quantification of relative protein level in (E) through grayscale analysis. Data are replicated with three independent experiments and shown as mean ± SD by a two-way ANOVA with multiple comparisons. ∗p < 0.05, ∗∗∗p < 0.001. See also Figure S2.
|
