
- Title
-
Creatine and L-carnitine attenuate muscular laminopathy in the LMNA mutation transgenic zebrafish
- Authors
- Pan, S.W., Wang, H.D., Hsiao, H.Y., Hsu, P.J., Tseng, Y.C., Liang, W.C., Jong, Y.J., Yuh, C.H.
- Source
- Full text @ Sci. Rep.
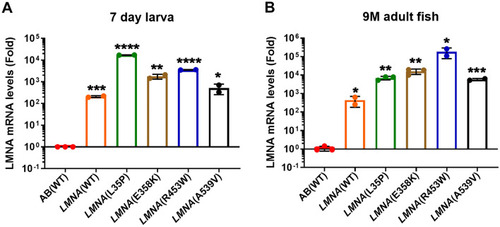
Elevated |
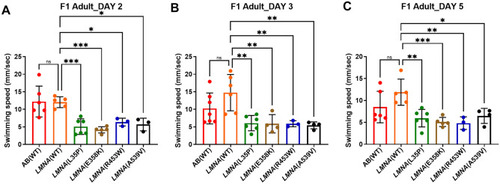
Swim speed analysis of F1 adult zebrafish expressing mutant human lamin A/C with those expressing WT human lamin A/C. ( PHENOTYPE:
|
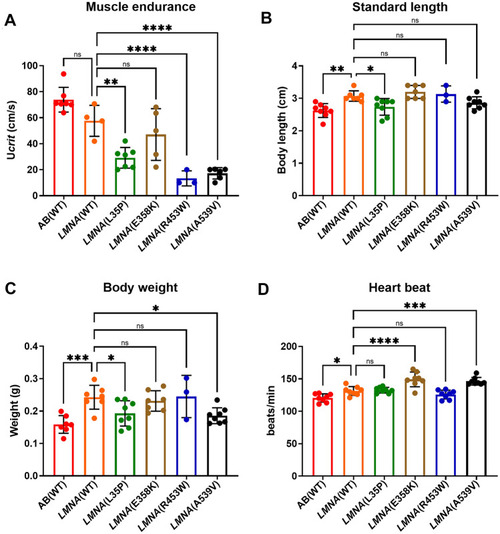
The muscle endurance and heartbeat measurements of F1 adult PHENOTYPE:
|

Histopathological analysis of muscle specimens from F1 adult PHENOTYPE:
|

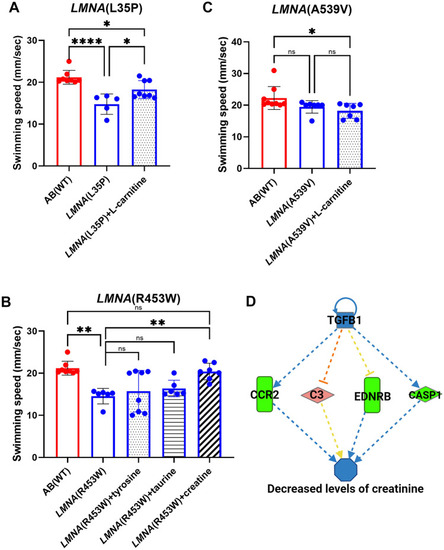
The effects of chemical treatment on F2 heterozygous larvae of |
The muscle endurance of 1-month-old F2 heterozygous PHENOTYPE:
|
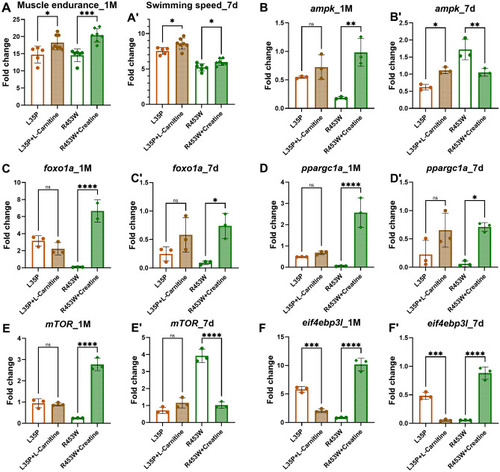
The expression patterns of the AMPK and mTOR pathways in chemical treated 7-day-old larvae and 1-month-old F2 heterozygous EXPRESSION / LABELING:
PHENOTYPE:
|

Ingenuity Pathway Analysis (IPA) network pathway analysis uncovers dysregulated genes in PHENOTYPE:
|