FIGURE

Figure 2

ID
ZDB-FIG-240606-37
Publication
Pan et al., 2024 - Creatine and L-carnitine attenuate muscular laminopathy in the LMNA mutation transgenic zebrafish
Other Figures
All Figure Page
Back to All Figure Page
Figure 2

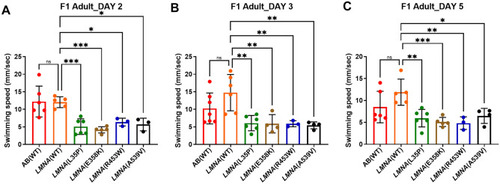
Swim speed analysis of F1 adult zebrafish expressing mutant human lamin A/C with those expressing WT human lamin A/C. (A–C) Swim speed analysis of F1 adult fish using T-maze behavior. The red plot represents AB(WT) fish, orange plot represents LMNA(WT) fish, green plot represents LMNA(L35P) fish, brown plot for LMNA(E358K) fish, blue plot for LMNA(R453W) fish, purple plot for LMNA(W520G) fish, and black plot for LMNA(A539V) fish. Each dot represents one fish. AB(WT): n = 6; LMNA(WT): n = 6; LMNA(L35P): n = 6; LMNA(E358K): n = 5; LMNA(R453W): n = 3; LMNA(A539V): n = 4. Statistical analysis was performed using ordinary One-way ANOVA comparing the mean of each column with the mean of control column (LMNA(WT)), and corrected for multiple comparisons using Dunnett’s test. The presented p-values have been appropriately adjusted, and the level of statistical significance is indicated by the following notation: *0.01 < P ≤ 0.05; **0.001 < P ≤ 0.01; ***0.0001 < P ≤ 0.001; ****P ≤ 0.0001.

Expression Data

Expression Detail
Antibody Labeling
Phenotype Data
Fish:
Observed In:
Stage: Adult

Phenotype Detail
Acknowledgments
This image is the copyrighted work of the attributed author or publisher, and ZFIN has permission only to display this image to its users. Additional permissions should be obtained from the applicable author or publisher of the image. Full text @ Sci. Rep.