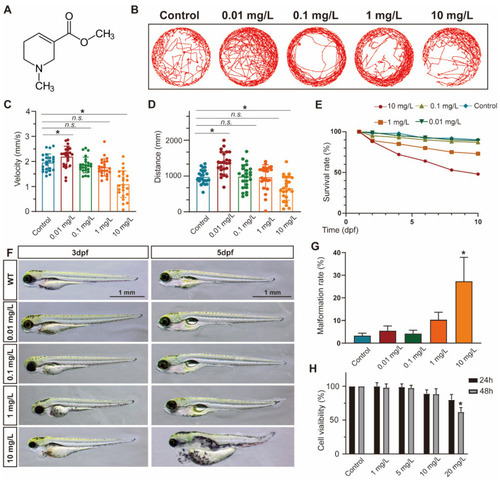
ACL exposure caused developmental malformations in zebrafish at high concentrations. (A) The chemical structure of ACL. (B) Locomotion tracks, (C) average speed and (D) total movement distance of zebrafish larvae exposed to 0.01–10 mg/L ACL treatment at 5 dpf (n = 25). (E) Zebrafish embryos survival proportions treated with 0.01–10 mg/L ACL for 10 days. (F) Malformation phenotypes of embryos exposed to 0.01–10 mg/L ACL for 3–5 days. (G) Malformation rate of different concentrations of ACL-treated embryos in 5 dpf (n = 50). (H) Cell viability of MC3T3-E1 cells under various concentrations of ACL for 24 h or 48 h, blank was treated as the control group. Data are expressed as the mean ± standard deviation (SD), * p < 0.05 versus the control group.

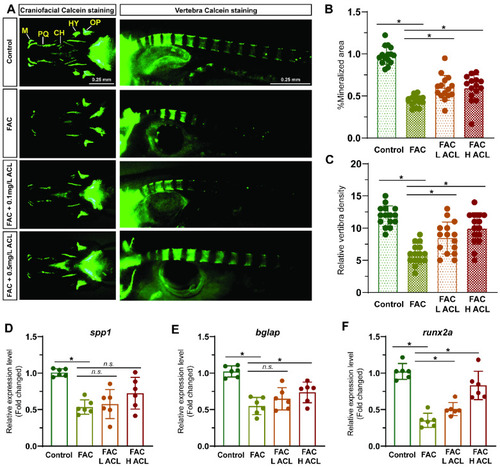
ACL attenuated the inhibition effect of FAC in bone formation in zebrafish. (A) Calcein staining of zebrafish larvae (7 dpf) cranium from control, FAC (200 µg/mL), FAC with low (0.1 mg/L) or high (0.5 mg/L) concentration ACL treatment groups. (B) Mineralized areas were quantified and shown in the graph. (C) The number of calcein-stained vertebra bodies were calculated. (DF) The relative mRNA expression of spp1, bglap and runx2a in zebrafish larvae treated with blank medium, FAC, FAC + high (0.5 mg/L) or low (0.1 mg/L) ACL were determined by qPCR. The mean value of blank medium-only treated group was set to 1.0. Data are showed as mean ± standard error. * means p < 0.05 between two indicated groups (n = 6). M, Meckel; PQ, palatoquadrate; CH, ceratohy; HY, hyomandibula (hyosympletic); OP, opercula.

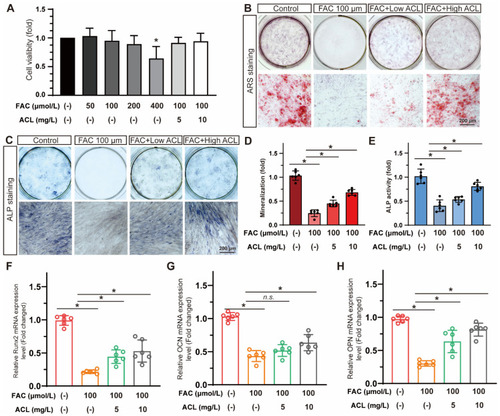
ACL promoted the osteogenic differentiation of MC3T3-E1 cells under FAC treatment. (A) Cell viability of MC3T3-E1 cells treated with different concentrations of FAC (0–400 µmol/L) with or without ACL (5 or 10 mg/L) for 24 h. * p < 0.05 versus control group. (B,C) Alizarin red staining and Alkaline phosphatase staining of MC3T3-E1 cells treated with 100 μmol/L FAC and exposed to 5 or 10 mg/L ACL for 1 or 2 weeks. (D,E) Degree of mineralization and Alkaline phosphatase activity were quantified, * means p < 0.05 between two indicated groups (n = 6). (FH) Quantitative analysis of mRNA expression levels of runt-related transcription factor 2 (Runx2), osteocalcin (OCN) and osteopontin (OPN) in MC3T3-E1 cells cultured in 100 μmol/L FAC with 5 or 10 mg/L ACL for 3 days. The control group was set to 1.0, * means p < 0.05 between two indicated groups (n = 6). Data are displayed as mean ± SD.

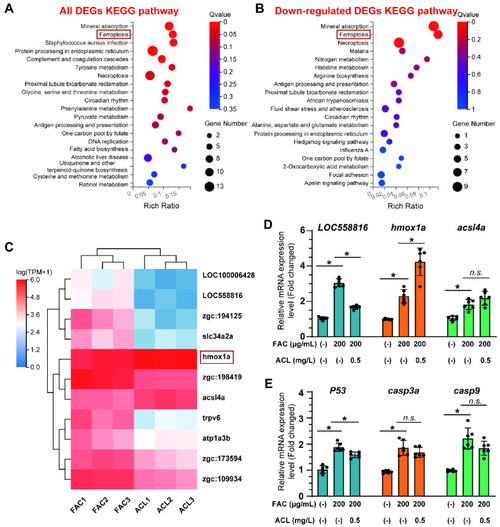
RNA-seq identified that ferroptosis may be involved in anti-osteoporosis effect of ACL under FAC exposure. (A) KEGG pathway enrichment analysis of all differentially expressed genes (DEGs) between ACL and ACL + FAC groups. (B) KEGG pathway enrichment analysis of down-regulated genes in ACL + FAC treated zebrafish larvae compared to ACL treated larvae. (C) Heatmap of 11 ferroptosis-related genes identified from DEGs. FAC represents the group treated with FAC alone, while ACL represents the group treated with both FAC and ACL. Each row represents one gene, and each column represents one sample. Red represents genes with high expression, blue represents genes with low expression. Darker colors indicate more significant differences. (D) Verification of mRNA expression level of ferroptosis-related genes in 5 dpf zebrafish larvae treated with 200 µg/mL FAC with or without 0.5 mg/L ACL. (E) Quantitative analysis of mRNA expression levels of three apoptosis genes, P53, casp3a and casp9. * means p < 0.05 between two indicated groups (n = 6). Data are displayed as mean ± SD.

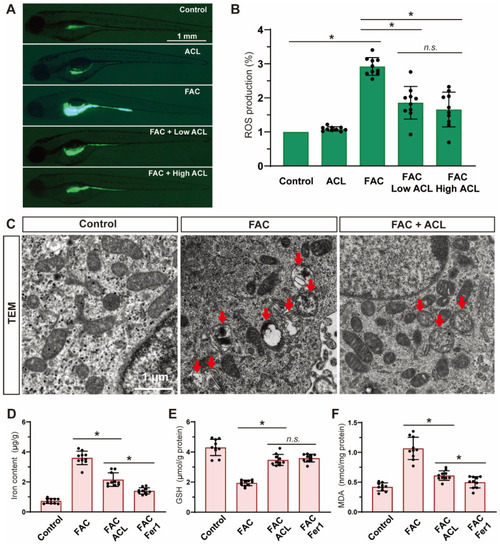
Ferroptosis was inhibited by ACL treatment under FAC exposure. (A,B) ROS production of zebrafish embryos (5 dpf) from control, FAC and FAC + (0.25 or 0.5 mg/L) ACL groups was detected and quantified by staining with DCF-DA, * means p < 0.05 between two indicated groups (n = 10). (C) Mitochondria ultrastructure of zebrafish embryo sections from control, FAC and FAC + ACL groups was imaged by transmission electron microscopy. Red arrows indicate damaged mitochondrial, including mitochondrial swelling, cristae lysis, and ruptured outer membrane. (DF) Iron, GSH and MDA levels were determined in whole zebrafish embryos (5 dpf) from control, FAC, FAC + ACL and FAC + Fer1 groups, the concentrations used in the experiments were as follows: FAC (200 μg/mL), ACL (0.5 mg/L), and Fer1 (1 μM), data were displayed as mean ± SD, * means p < 0.05 between two indicated groups (n = 10).

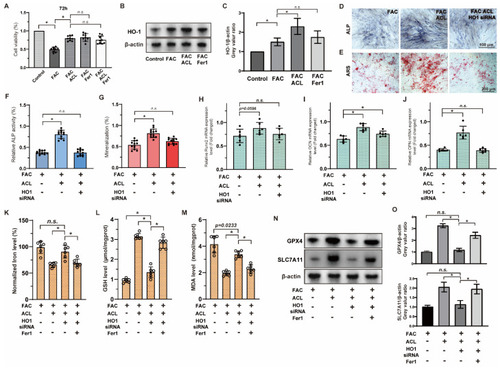
Inhibition of ferroptosis by ACL can be reversed by HO-1 inhibition. (A) The survival of MC3T3-E1 cells were examined using the Cell Counting Kit-8 assay. Cells were treated with FAC, FAC + ACL, FAC + Fer1 (Ferroptosis inhibitor) or FAC + ACL + Fer1 for 72 h. (B,C) The expression of HO-1 in control, FAC, FAC + ACL and FAC + Fer1 groups were analyzed by Western blotting. β-actin was used as internal reference. Relative expression levels were shown in the graph. * means p < 0.05 between two indicated groups (n = 3). (D,E) Alizarin red staining and Alkaline phosphatase staining of MC3T3-E1 cells treated with FAC, FAC + ACL or FAC + ACL + HO-1 siRNA (HO-1 knockdown) for 1 or 2 weeks. (F,G) Degree of mineralization and Alkaline phosphatase activity were quantified, * means p < 0.05 between two indicated groups (n = 6). (HJ) Quantitative analysis of mRNA expression levels of runt-related transcription factor 2 (Runx2), osteocalcin (OCN) and osteopontin (OPN) in MC3T3-E1 cells cultured in FAC (100 μmol/L), FAC + ACL (10 mg/L) or FAC + ACL + HO-1 siRNA (HO-1 knockdown) for 3 days. The control group was set to 1.0, * means p < 0.05 between two indicated groups (n = 6). (KM) Intracellular iron, GSH (Glutathione), lipid peroxidation MDA (Malondialdehyde) levels in FAC, FAC + ACL, FAC + ACL + HO-1 siRNA and FAC + ACL + HO-1 siRNA + Fer1 treated MC3T3-E1 cells were detected by commercialized assay kits. * means p < 0.05 between two indicated groups (n = 6). (N,O) The expression of ferroptosis associated genes, GPX4 and SLC7A11, in FAC, FAC + ACL, FAC + ACL + HO-1 siRNA and FAC + ACL + HO-1 siRNA + Fer1 treated MC3T3-E1 cells were determined by Western blotting. β-actin was used as internal reference. Relative expression levels were shown in the graph. The concentrations used in the experiments were as follows: FAC (100 μM), ACL (0.5 mg/L), and Fer1 (1 μM) * means p < 0.05 between two indicated groups (n = 3). All data are displayed as mean ± SD.

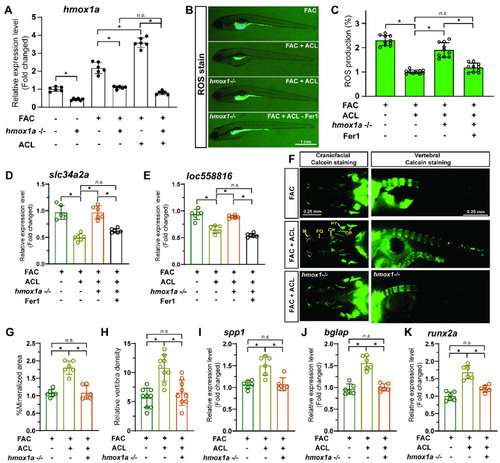
The protective effect of ACL can be inhibited by hmox1a knockout in zebrafish. (A) Zebrafish hmox1a mRNA level in control, FAC, FAC + ACL treated wildtype or hmox1a−/− larvae were analyzed by qPCR, * p < 0.05. (B,C) ROS production of embryos (5dpf) from two zebrafish lines, wildtype and hmox1a−/− larvae treated with FAC, FAC + ACL and FAC + ACL + Fer1 were detected and quantified by staining with DCF-DA, * means p < 0.05 between two indicated groups (n = 10). (D,E) Determination of mRNA expression level of ferroptosis-related genes in 5 dpf zebrafish larvae or hmox1a−/− larvae treated with 200 µg/mL FAC with or without 0.5 mg/L ACL. (F) Calcein staining images of wildtype and hmox1a−/− zebrafish larvae (7 dpf) treated with FAC, FAC + ACL. (G,H) The fluorescence intensity of vertebrae of zebrafish larvae in different groups were quantified and compared. * means p < 0.05 between two indicated groups (n = 15). (IK) The relative mRNA expression of zebrafish osteogenesis related genes, spp1, bglap and runx2a, in wildtype and hmox1a−/− zebrafish larvae treated with FAC, FAC + ACL were determined by qPCR. The mean value of FAC treated wildtype group was set to 1.0. The concentrations used in the experiments were as follows: FAC (200 μg/mL), ACL (0.5 mg/L), and Fer1 (1 μM), * means p < 0.05 between two indicated groups (n = 6). Data are displayed as mean ± SD.

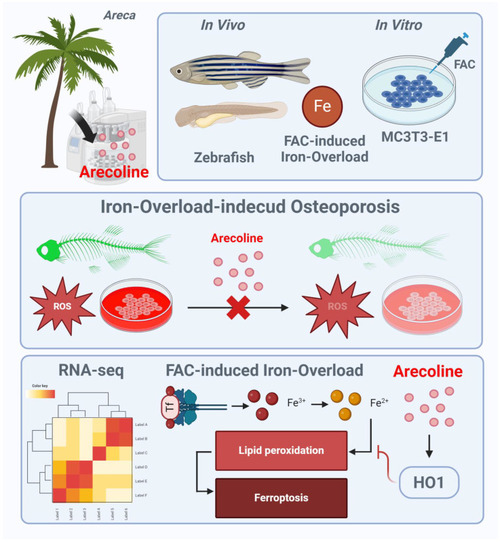
Schematic illustration of ACL for protecting FAC induced osteoporosis via upregulation of HO-1. FAC treatment leads to increased intracellular iron levels, lipid peroxidation, mitochondrial dysfunction, and oxidative stress, contributing to the inhibition of osteoblast differentiation and progression of osteoporosis. ACL attenuates these inhibitory effects by upregulating HO-1 expression. HO-1 activation promotes iron recycling and exerts antioxidant effects, thereby suppressing hallmarks of ferroptosis. The illustration figure was created by BioRender.

Acknowledgments
This image is the copyrighted work of the attributed author or publisher, and ZFIN has permission only to display this image to its users. Additional permissions should be obtained from the applicable author or publisher of the image. Full text @ Antioxidants (Basel)