IMAGE

Figure 1

ID
ZDB-IMAGE-240429-92
Source
Figures for Jiang et al., 2024
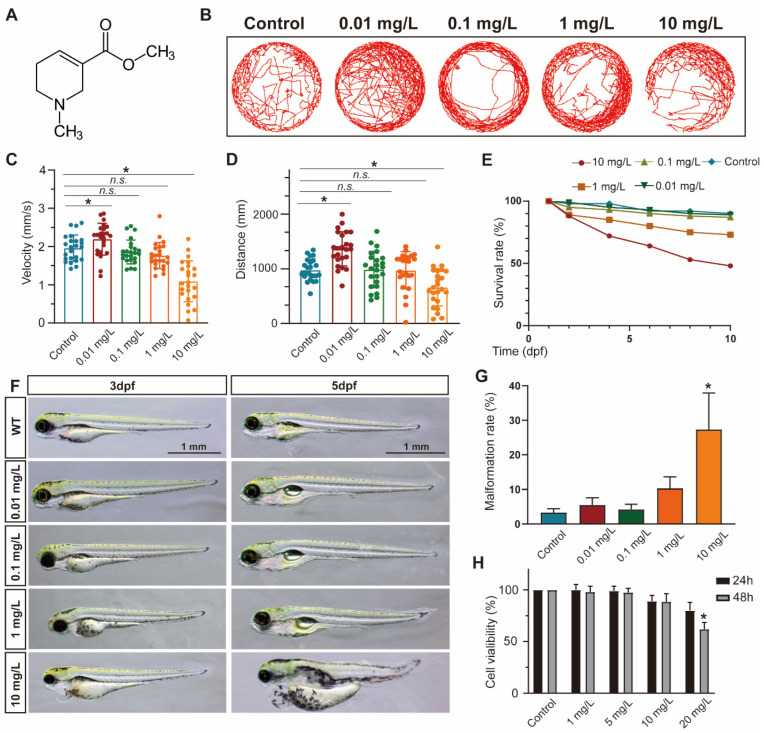
Image
Figure Caption

Figure 1

ACL exposure caused developmental malformations in zebrafish at high concentrations. (A) The chemical structure of ACL. (B) Locomotion tracks, (C) average speed and (D) total movement distance of zebrafish larvae exposed to 0.01–10 mg/L ACL treatment at 5 dpf (n = 25). (E) Zebrafish embryos survival proportions treated with 0.01–10 mg/L ACL for 10 days. (F) Malformation phenotypes of embryos exposed to 0.01–10 mg/L ACL for 3–5 days. (G) Malformation rate of different concentrations of ACL-treated embryos in 5 dpf (n = 50). (H) Cell viability of MC3T3-E1 cells under various concentrations of ACL for 24 h or 48 h, blank was treated as the control group. Data are expressed as the mean ± standard deviation (SD), * p < 0.05 versus the control group.

Acknowledgments
This image is the copyrighted work of the attributed author or publisher, and ZFIN has permission only to display this image to its users. Additional permissions should be obtained from the applicable author or publisher of the image. Full text @ Antioxidants (Basel)