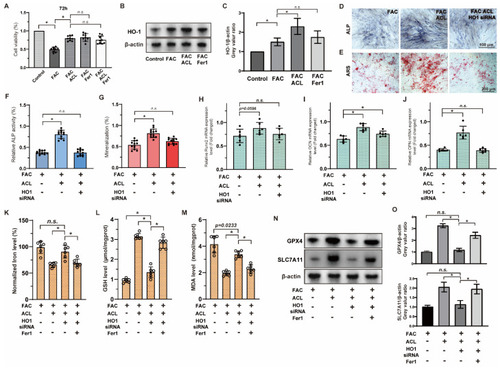
Inhibition of ferroptosis by ACL can be reversed by HO-1 inhibition. (A) The survival of MC3T3-E1 cells were examined using the Cell Counting Kit-8 assay. Cells were treated with FAC, FAC + ACL, FAC + Fer1 (Ferroptosis inhibitor) or FAC + ACL + Fer1 for 72 h. (B,C) The expression of HO-1 in control, FAC, FAC + ACL and FAC + Fer1 groups were analyzed by Western blotting. β-actin was used as internal reference. Relative expression levels were shown in the graph. * means p < 0.05 between two indicated groups (n = 3). (D,E) Alizarin red staining and Alkaline phosphatase staining of MC3T3-E1 cells treated with FAC, FAC + ACL or FAC + ACL + HO-1 siRNA (HO-1 knockdown) for 1 or 2 weeks. (F,G) Degree of mineralization and Alkaline phosphatase activity were quantified, * means p < 0.05 between two indicated groups (n = 6). (H–J) Quantitative analysis of mRNA expression levels of runt-related transcription factor 2 (Runx2), osteocalcin (OCN) and osteopontin (OPN) in MC3T3-E1 cells cultured in FAC (100 μmol/L), FAC + ACL (10 mg/L) or FAC + ACL + HO-1 siRNA (HO-1 knockdown) for 3 days. The control group was set to 1.0, * means p < 0.05 between two indicated groups (n = 6). (K–M) Intracellular iron, GSH (Glutathione), lipid peroxidation MDA (Malondialdehyde) levels in FAC, FAC + ACL, FAC + ACL + HO-1 siRNA and FAC + ACL + HO-1 siRNA + Fer1 treated MC3T3-E1 cells were detected by commercialized assay kits. * means p < 0.05 between two indicated groups (n = 6). (N,O) The expression of ferroptosis associated genes, GPX4 and SLC7A11, in FAC, FAC + ACL, FAC + ACL + HO-1 siRNA and FAC + ACL + HO-1 siRNA + Fer1 treated MC3T3-E1 cells were determined by Western blotting. β-actin was used as internal reference. Relative expression levels were shown in the graph. The concentrations used in the experiments were as follows: FAC (100 μM), ACL (0.5 mg/L), and Fer1 (1 μM) * means p < 0.05 between two indicated groups (n = 3). All data are displayed as mean ± SD.
|
