
- Title
-
Inhibition of NF-κB-Mediated Proinflammatory Transcription by Ru(II) Complexes of Anti-Angiogenic Ligands in Triple-Negative Breast Cancer
- Authors
- Chakraborty, A., Ghosh, S., Chakraborty, M.P., Mukherjee, S., Roy, S.S., Das, R., Acharya, M., Mukherjee, A.
- Source
- Full text @ J. Med. Chem.
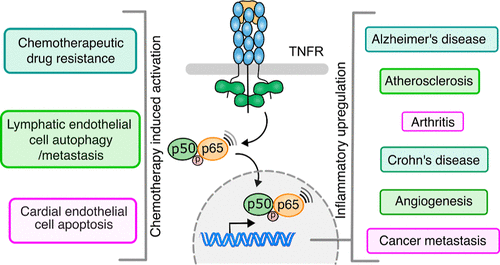
Model diagram for the consequences of activation of NF-κB, a pivotal mediator of inflammation. On the right side, the diagram shows various diseases whose pathogenesis is related to the pivotal role of NF-κB. NF-κB being an inducible transcription factor can activate transcription of genes regulating inflammation, increasing the production of inflammatory cytokines, chemokines, adhesion molecules, proliferation, morphogenesis, differentiation, and angiogenesis. The left side of the diagram showcases few selective outcomes of chemotherapy-induced activation of NF-κB leading to drug resistance, endothelial cell autophagy, and enhanced permeability and apoptosis of cardiac cell damage. |
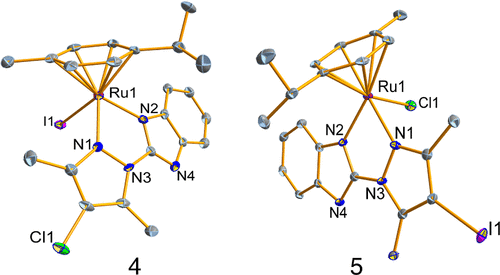
Structural representation of complexes 4 and 5. Thermal ellipsoids are drawn at 50% probability and all hydrogen atoms, counteranions, and solvent molecules were omitted for clarity. |
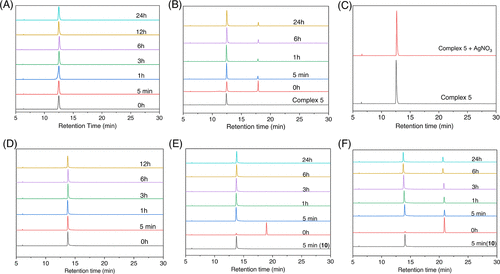
HPLC chromatograms of stability of complexes in 2:8 v/v DMSO and phosphate buffer (10 mM phosphate, 4 mM NaCl, pH 7.4) at different time intervals except (C) where the study was conducted in the presence of 1 equiv AgNO3 in 2:8 v/v DMSO/H2O. (A) Complex 5 showing the presence of a single peak, which corresponds to the monoaquated species as confirmed from the study in (C) where complex 5 is intentionally hydrolyzed instantaneously using 1 equiv of AgNO3 showing the same single peak at 12.5 min. (B) Complex 6 showing the monoaquated complex (12.5 min) and the intact 6 at 17.9 min. (D) Aquation of 10–12 showing the monoaquated complexes to be the sole species for 10 and 11, whereas 12 shows intact complex and monoaquated species in the beginning where the intact complexes decreases with time. Data plots from (E) and (F) show that both 11 and 12 convert into 10 in solution due to monoaquation. The time points indicated on the plot represent the injection times of these complexes. Mobile phase: mixture of water and acetonitrile (MeCN). Elution gradient: starting at 5% MeCN and gradually increasing to 95% MeCN over a 30 min duration. Flow rate: 1 mL/min. The reference point at 0 h corresponds to the stability of complexes in a 200 μM dimethyl sulfoxide (DMSO) solution. Detector UV channel = 254 nm. |

Cellular accumulation of ruthenium in MDA-MB-231 cells upon treatment for 12 h using a 5 μM concentration for all the complexes showing increased accumulation for more lipophilic complexes. Gray (1–6; dimethylpyrazolyl-benzimidazole based complexes), golden brown (7–12; monomethylpyrazolyl-benzimidazole-based complexes). |

(A) Schematic representation of VEGFR2 signaling in angiogenesis. (64,65) Signaling modules probed are highlighted (KEGG pathway database). (B–D) In the left panel is the representative Western blot showing the level of VEGFR2(B), PLC-γ (C), and ERK1/2 (D) phosphorylation after treating the HMEC-1 cells with the indicated compounds (10 μM) for 6 h followed by activation with VEGF165 (30 ng/mL). In the right panel, the bar plots represent the densitometric quantification of Y1175(B), Y783(C), or T202/Y204(D) phosphorylation level after compound treatment. The error bar is the standard deviation from three independent experiments. (E) Ca2+ flux is determined from the plot of change in fluorescence of Fluo-4 as a function of time in HMEC-1 cells treated with the indicated compounds (10 μM) for 3 h followed by activation with VEGF165 (30 ng/mL). |

(A) Histogram depicting the dose-dependent (5 and 10 μM) induction of apoptosis by complexes 6 and 12 in MDA-MB-231 cells after 16 h of treatment, as analyzed through flow cytometry. (B) Flow cytometry analysis of the mitochondrial depolarization using JC-1 dye following treatment with 5 and 10 μM of 6 or 12 for 8, 16, and 36 h incubation periods reveal a notable, dose- and time-dependent elevation in monomeric JC-1 fluorescence. This observation is indicative of enhanced mitochondrial membrane depolarization, highlighting the intricate relationship between treatment, dosage, time, and mitochondrial function. |

Inhibition of TNF-α-mediated NF-κB activation and its nuclear localization by complexes 6 and 12. (A) In the upper panel, the immunoblot shows the level of S536 phosphorylation in NF-κB phosphorylation after treating the MDA-MB-231 cells with indicated compounds (10 μM) for 6 h followed by activation with TNF-α. In the lower panel, the bar plots represent the densitometric quantification of S563 phosphorylation level after the indicated compound treatment. The error bar shows standard deviation from three independent experiments. (B) Representative confocal images of MDA-MB-231 cells showing TNF-α-mediated NF-κB nuclear localization (TNF-α treatment for 40 min) after treatment with the indicated complex for 2 h followed by activation with TNF-α for 40 min, as indicated in each panel. F-actin and the nucleus are stained with phalloidin (gray) and DAPI (blue), respectively. Scale bar, 10 μm. (C) Quantification of colocalization between NF-κB and DAPI by Menders correlation coefficient (MCC) at the indicated experimental condition. Scale bar = 10 μm. (Cell number = 120–160) in the cytoplasm of MDA-MB-231 cells suggesting that the complexes inhibit the phosphorylation and nuclear translocation of NF-κB. Furthermore, in agreement with the literature, the NF-κB inhibitory activity of 6 or 12 promotes mitochondrial stress, leading to its depolarization and the release of cytochrome C to induce caspase-3/7-mediated intrinsic pathway of apoptosis. |

(A) Representative confocal images of HMEC-1 cells showing TNF-α-mediated NF-κB nuclear localization after treatment with the indicated complex (10 μM) for 2 h followed by activation with TNF-α for 1 h, as indicated in each panel. F-actin and the nucleus are stained with phalloidin (gray) and DAPI (blue), respectively. Scale bar, 30 μm. (B) Quantification of colocalization between NF-κB and DAPI by MCC at the indicated experimental condition. (Cell number = 150–180) in the cytoplasm of HMEC-1 cells suggesting that the complexes inhibit the nuclear translocation of NF-κB. |

Solution stability of the most efficient complexes and their response to 9-EtG and ROSs at pH 7.4. The scheme depicts the reactivity of the complexes toward 9-EtG only detected by ESI-HRMS but not detected in HPLC. The generation of the free ligand along with the monoaquated metal complex in the presence of ROS is shown both by HPLC and ESI-HRMS. The diagram shows that the complexes show a strong tendency to form a stable monoaquated adduct quickly in aqueous solution at pH 7.4. |
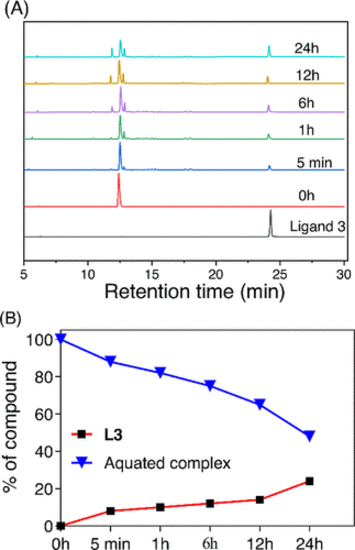
Release of L3 from complex 5 (200 μM) when incubated with 3 equiv of H2O2 (600 μM) in 10 mM phosphate buffer (pH 7.4) with 4 mM NaCl. (A) HPLC traces at different time intervals showing the release of the free ligand in the presence of ROS and generation of the monoaquated complex and two other uncharacterized ligand bound complexes. Detector UV channel = 254 nm. (B) Plot of the percentage dissociation of 5 in the presence of 3 equiv of H2O2 and percentage release of L3. After 24 h, 25% ligand release was observed. |
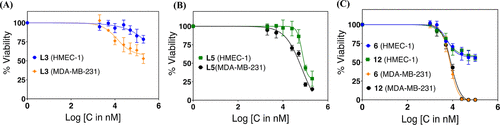
Cell viability comparison between HMEC-1 and MDA-MB-231 cell lines upon treatment with various doses of L3, L5, 6, and 12 for 72 h. (A) L3 showing lower toxicity toward HMEC-1 compared to MDA-MB-231. (B) L5 showing closely similar toxicity profile toward HMEC-1 and MDA-MB-231. (C) Complexes 6 and 12 showing a significantly lower toxicity toward HMEC-1 compared to MDA-MB-231 and unable to kill beyond 50% even at a 100 μM dose. A comparison of the data for L5 in (B) and its complex 12 in (C) shows that the ligand is more toxic in vitro than the complex on HMEC-1 [the x-axis denotes the logarithmic concentration (nanomolar) of the compounds]. |

In vivo antiangiogenic effects of L3 (3 μM) and L5 (3 μM) in Tg(Fli1:gfp) Zebrafish through in vivo experiments conducted at various time intervals. The compound addition was done at 14hpf and incubation continued for 12 h. The GFP-expressing regions of interest, including the duct of Cuvier, dorsal aorta, ISVs, and caudal vein, are indicated by white arrows in the control group treated with 0.2% DMSO. Sunitinib malate (3 μM) was taken as the positive control. Conversely, the affected areas, reflected by the loss of the GFP-expressing vasculature due to the antiangiogenic effect in the treated samples, are identified by red arrows. The data show that between L3 and L5, the most effective one is L5 at just a 3 μM concentration, showing a strong antiangiogenic effect even at 48 hpf when the zebrafish recovered partly from the effect of L3. The commercial drug sunitinib malate used as standard shows the strongest effect. |

Funnel Diagram Depicting the Sorting of the Ru(II) Complexes |
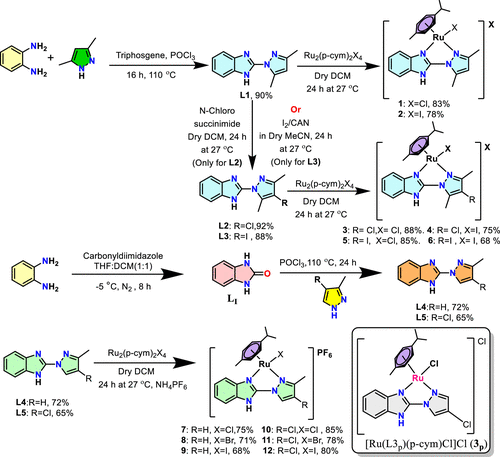
Synthesis of Ligands (L1–L5) and Metal Complexes (1–12) Depicting the Solvent, Temperature, and Duration of Synthesis |
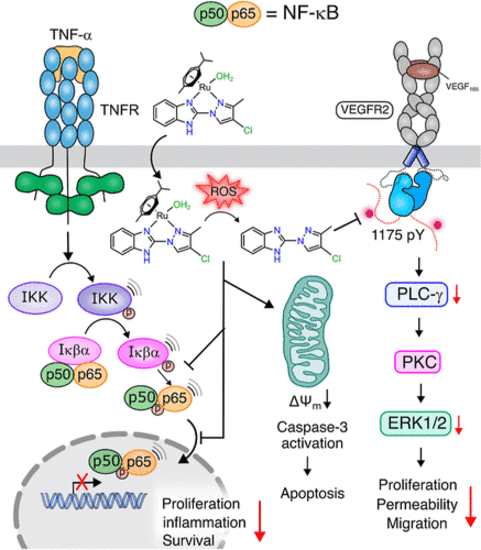
Illustration Depicting the Mechanism of the Inhibition of NF-κB Signaling Cascade Shown by the Complexes (Represented by Complex 12) |