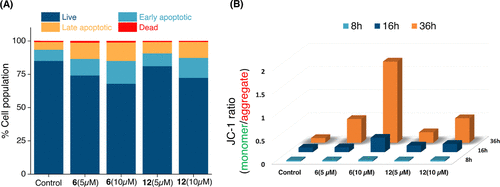
Fig. 6 (A) Histogram depicting the dose-dependent (5 and 10 μM) induction of apoptosis by complexes 6 and 12 in MDA-MB-231 cells after 16 h of treatment, as analyzed through flow cytometry. (B) Flow cytometry analysis of the mitochondrial depolarization using JC-1 dye following treatment with 5 and 10 μM of 6 or 12 for 8, 16, and 36 h incubation periods reveal a notable, dose- and time-dependent elevation in monomeric JC-1 fluorescence. This observation is indicative of enhanced mitochondrial membrane depolarization, highlighting the intricate relationship between treatment, dosage, time, and mitochondrial function.
Image
Figure Caption
Acknowledgments
This image is the copyrighted work of the attributed author or publisher, and
ZFIN has permission only to display this image to its users.
Additional permissions should be obtained from the applicable author or publisher of the image.
Full text @ J. Med. Chem.

