
- Title
-
Integration of Metabolomics and Transcriptomics to Reveal the Metabolic Characteristics of Exercise-Improved Bone Mass
- Authors
- Hou, J.L., Yang, W.Y., Zhang, Q., Feng, H., Wang, X.B., Li, H., Zhou, S., Xiao, S.M.
- Source
- Full text @ Nutrients
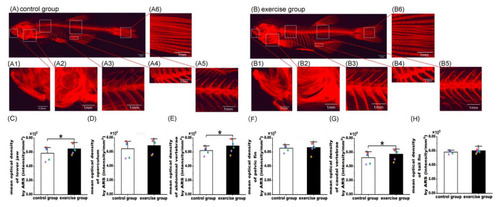
Alizarin red S (ARS) staining of bone tissue and quantification of bone mineralization in the control and exercise groups. Fluorescent image of ARS staining of zebrafish to visualize the whole-body skeleton of the control (A) and exercise (B) groups. Magnified fluorescent images of the lower jaw (A1,B1), operculum (A2,B2), abdominal vertebrae (A3,B3), pelvic fin (A4,B4), caudal vertebrae (A5,B5), and tail fin (A6,B6). Comparison of mean optical density in the lower jaw (C), operculum (D), abdominal vertebrae (E), pelvic fin (F), caudal vertebrae (G), and tail fin (H) between the exercise and control groups. The values of mean optical density are expressed as mean and standard deviation. A mixed linear model containing both fixed effects (e.g., intervention method) and random effects (e.g., photographing time) was used to evaluate the impact of exercise on bone mineralization in the lower jaw, operculum, abdominal vertebrae, pelvic fin, caudal vertebrae, and tail fin. The black, red, blue, green, and purple squares represent the control group fish numbers 13, 14, 15, 16, and 17, respectively. The black, red, blue, green, purple, and yellow diamonds represent exercise group fish numbers 14, 15, 16, 17, 18, and 19, respectively. *, p < 0.05. |
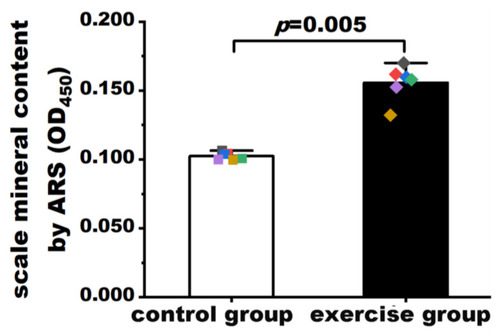
Quantification of mineralization in scales of the exercise and control groups. Values are expressed as mean and standard deviation. Student’s t test was used to compare the differences in mineralization levels between the exercise group and the control group. The black, red, blue, green, purple, and yellow squares represent control group fish numbers 13, 14, 15, 16, 17, and 18, respectively. The black, red, blue, green, purple, and yellow diamonds represent exercise group fish numbers 14, 15, 16, 17, 18, and 19, respectively. |

Measurements of alkaline phosphatase (Alp) and anti-tartrate acid phosphatase (Trap) activities in the control and exercise groups. Results of histological staining of Alp activities (A,B) and Trap activities (C,D; black arrows indicate the resorption activity along the anterior/lateral edge); closer views of histological staining of Alp activities (E,F; black arrows indicate the ALP-positive cells); results of biochemical assay of Alp activities and Trap activities (G,H). Values are expressed as mean and standard deviation. Student’s t test was used to compare the differences in biochemical activities of Alp and Trap between the exercise group and the control group. The black, red, blue, green, purple, and yellow squares represent control group fish number 13, 14, 15, 16, 17, and 18, respectively. The black, red, blue, green, purple, and yellow diamonds represent exercise group fish numbers 14, 15, 16, 17, 18, and 19, respectively. |
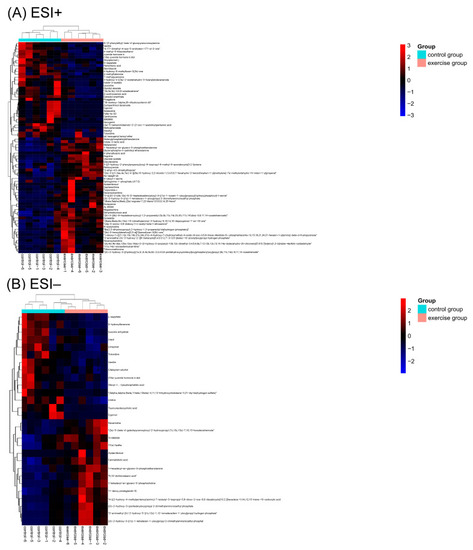
Heat map of the differential metabolites (DMs) in the positive electron spray ionization (ESI+) and negative electron spray ionization (ESI−) modes (A,B). Red color represents relative increase in abundance, and blue color represents relative decreases in abundance. Color codes are indicated in the color bar on the right side. |

Bubble plots for metabolic pathway enrichment analysis of the differential metabolites (DMs) in the positive electron spray ionization (ESI+) and negative electron spray ionization (ESI−) modes (A,B). The y-axis is the enriched metabolic pathway, and the x-axis is the enrichment factor (RichFactor). The larger the value of RichFactor, the greater the proportion of DMs annotated to the pathway. The size of dots represents the number of DMs annotated to a given pathway. |
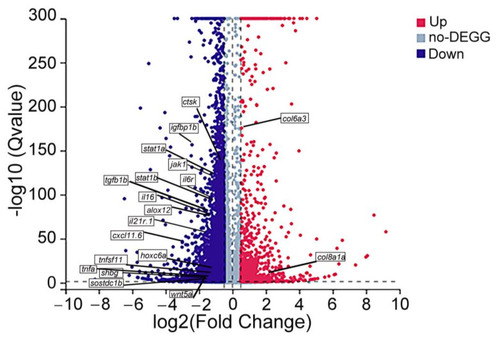
Volcano map of differentially expressed genes (DEGs). The dots represent downregulated (blue) and upregulated (red) DEGs. Genes without difference between the two groups are labeled in purple–gray. The genes in the boxes are reported genes related to bone metabolism. |
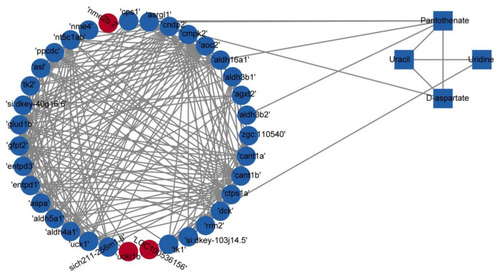
Correlation-based networks of metabolites and genes in the four identified pathways. Rectangles represent metabolites, and circles represent genes. Red indicates upregulation, and blue indicates downregulation. |
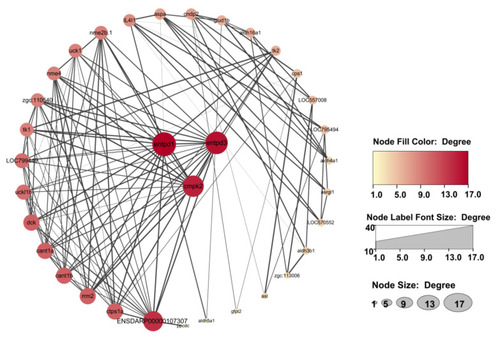
Protein–protein interaction network analysis of 35 differentially expressed genes in the four identified pathways. Entpd3, entpd1, and cmpk2 located in the center of the network are core genes. |

The results of mRNA expression by qRT-PCR for entpd3 (A), entpd1 (B), and cmpk2 (C, the core genes) in the control and exercise groups. All values are presented as mean and standard deviation. Student’s t test was used to compare the differences between the two groups. |
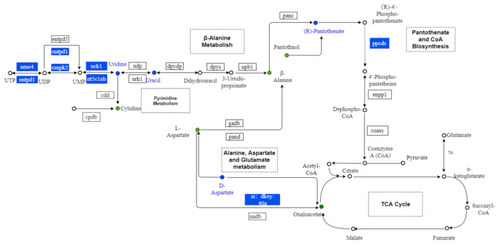
Metabolic maps of alanine, aspartate, and glutamate metabolism, pantothenate and CoA biosynthesis; pyrimidine metabolism; and β-alanine metabolism. Dots represent the metabolites. Boxes represent the genes. Blue indicates downregulation. |