
FIGURE
Figure 10
- ID
- ZDB-FIG-230416-6
- Publication
- Hou et al., 2023 - Integration of Metabolomics and Transcriptomics to Reveal the Metabolic Characteristics of Exercise-Improved Bone Mass
- Other Figures
- All Figure Page
- Back to All Figure Page
Figure 10
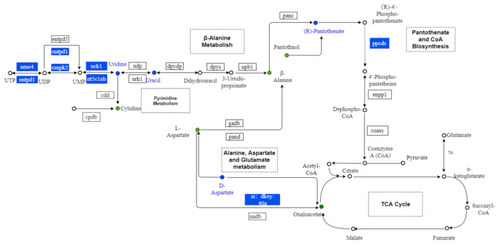
Metabolic maps of alanine, aspartate, and glutamate metabolism, pantothenate and CoA biosynthesis; pyrimidine metabolism; and β-alanine metabolism. Dots represent the metabolites. Boxes represent the genes. Blue indicates downregulation. |
Expression Data
Expression Detail
Antibody Labeling
Phenotype Data
Phenotype Detail
Acknowledgments
This image is the copyrighted work of the attributed author or publisher, and
ZFIN has permission only to display this image to its users.
Additional permissions should be obtained from the applicable author or publisher of the image.
Full text @ Nutrients