
|
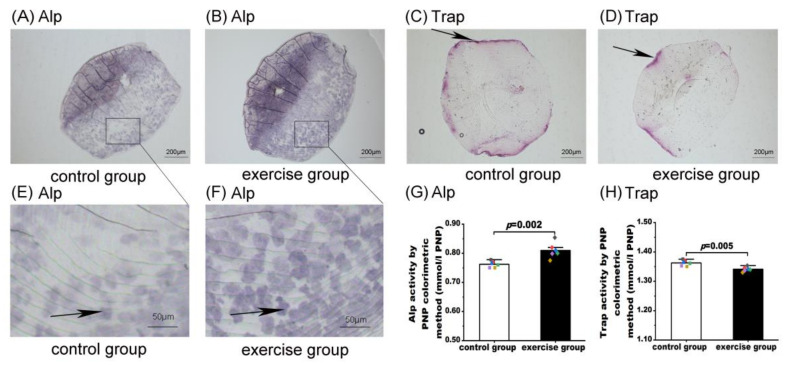
Figure 3
Measurements of alkaline phosphatase (Alp) and anti-tartrate acid phosphatase (Trap) activities in the control and exercise groups. Results of histological staining of Alp activities (A,B) and Trap activities (C,D; black arrows indicate the resorption activity along the anterior/lateral edge); closer views of histological staining of Alp activities (E,F; black arrows indicate the ALP-positive cells); results of biochemical assay of Alp activities and Trap activities (G,H). Values are expressed as mean and standard deviation. Student’s t test was used to compare the differences in biochemical activities of Alp and Trap between the exercise group and the control group. The black, red, blue, green, purple, and yellow squares represent control group fish number 13, 14, 15, 16, 17, and 18, respectively. The black, red, blue, green, purple, and yellow diamonds represent exercise group fish numbers 14, 15, 16, 17, 18, and 19, respectively.