
Figure 1
- ID
- ZDB-FIG-230416-8
- Publication
- Hou et al., 2023 - Integration of Metabolomics and Transcriptomics to Reveal the Metabolic Characteristics of Exercise-Improved Bone Mass
- Other Figures
- All Figure Page
- Back to All Figure Page
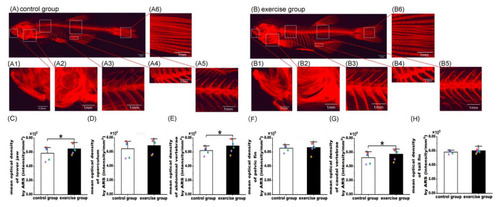
Alizarin red S (ARS) staining of bone tissue and quantification of bone mineralization in the control and exercise groups. Fluorescent image of ARS staining of zebrafish to visualize the whole-body skeleton of the control (A) and exercise (B) groups. Magnified fluorescent images of the lower jaw (A1,B1), operculum (A2,B2), abdominal vertebrae (A3,B3), pelvic fin (A4,B4), caudal vertebrae (A5,B5), and tail fin (A6,B6). Comparison of mean optical density in the lower jaw (C), operculum (D), abdominal vertebrae (E), pelvic fin (F), caudal vertebrae (G), and tail fin (H) between the exercise and control groups. The values of mean optical density are expressed as mean and standard deviation. A mixed linear model containing both fixed effects (e.g., intervention method) and random effects (e.g., photographing time) was used to evaluate the impact of exercise on bone mineralization in the lower jaw, operculum, abdominal vertebrae, pelvic fin, caudal vertebrae, and tail fin. The black, red, blue, green, and purple squares represent the control group fish numbers 13, 14, 15, 16, and 17, respectively. The black, red, blue, green, purple, and yellow diamonds represent exercise group fish numbers 14, 15, 16, 17, 18, and 19, respectively. *, p < 0.05. |