
FIGURE
Figure 4
- ID
- ZDB-FIG-230416-11
- Publication
- Hou et al., 2023 - Integration of Metabolomics and Transcriptomics to Reveal the Metabolic Characteristics of Exercise-Improved Bone Mass
- Other Figures
- All Figure Page
- Back to All Figure Page
Figure 4
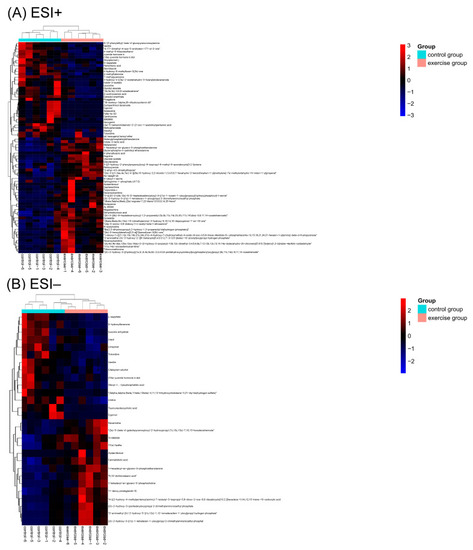
Heat map of the differential metabolites (DMs) in the positive electron spray ionization (ESI+) and negative electron spray ionization (ESI−) modes (A,B). Red color represents relative increase in abundance, and blue color represents relative decreases in abundance. Color codes are indicated in the color bar on the right side. |
Expression Data
Expression Detail
Antibody Labeling
Phenotype Data
Phenotype Detail
Acknowledgments
This image is the copyrighted work of the attributed author or publisher, and
ZFIN has permission only to display this image to its users.
Additional permissions should be obtained from the applicable author or publisher of the image.
Full text @ Nutrients