
Image
|
Figure Caption
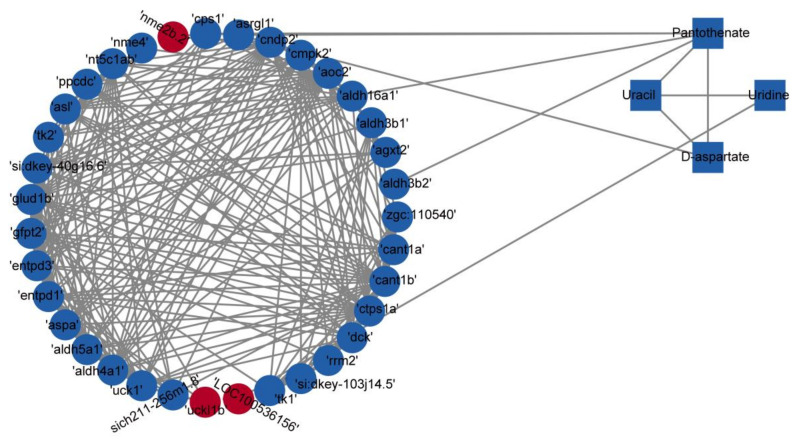
Figure 7
Correlation-based networks of metabolites and genes in the four identified pathways. Rectangles represent metabolites, and circles represent genes. Red indicates upregulation, and blue indicates downregulation.
Acknowledgments
This image is the copyrighted work of the attributed author or publisher, and
ZFIN has permission only to display this image to its users.
Additional permissions should be obtained from the applicable author or publisher of the image.
Full text @ Nutrients