
Image
|
Figure Caption
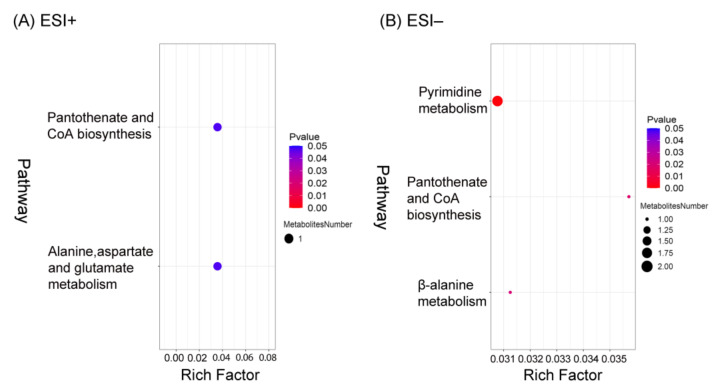
Figure 5
Bubble plots for metabolic pathway enrichment analysis of the differential metabolites (DMs) in the positive electron spray ionization (ESI+) and negative electron spray ionization (ESI−) modes (A,B). The y-axis is the enriched metabolic pathway, and the x-axis is the enrichment factor (RichFactor). The larger the value of RichFactor, the greater the proportion of DMs annotated to the pathway. The size of dots represents the number of DMs annotated to a given pathway.
Acknowledgments
This image is the copyrighted work of the attributed author or publisher, and
ZFIN has permission only to display this image to its users.
Additional permissions should be obtained from the applicable author or publisher of the image.
Full text @ Nutrients