
Image
|
Figure Caption
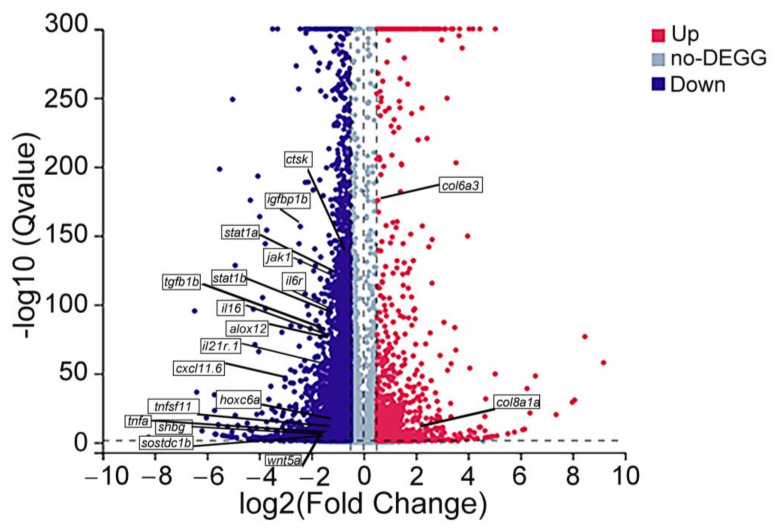
Figure 6
Volcano map of differentially expressed genes (DEGs). The dots represent downregulated (blue) and upregulated (red) DEGs. Genes without difference between the two groups are labeled in purple–gray. The genes in the boxes are reported genes related to bone metabolism.
Acknowledgments
This image is the copyrighted work of the attributed author or publisher, and
ZFIN has permission only to display this image to its users.
Additional permissions should be obtained from the applicable author or publisher of the image.
Full text @ Nutrients